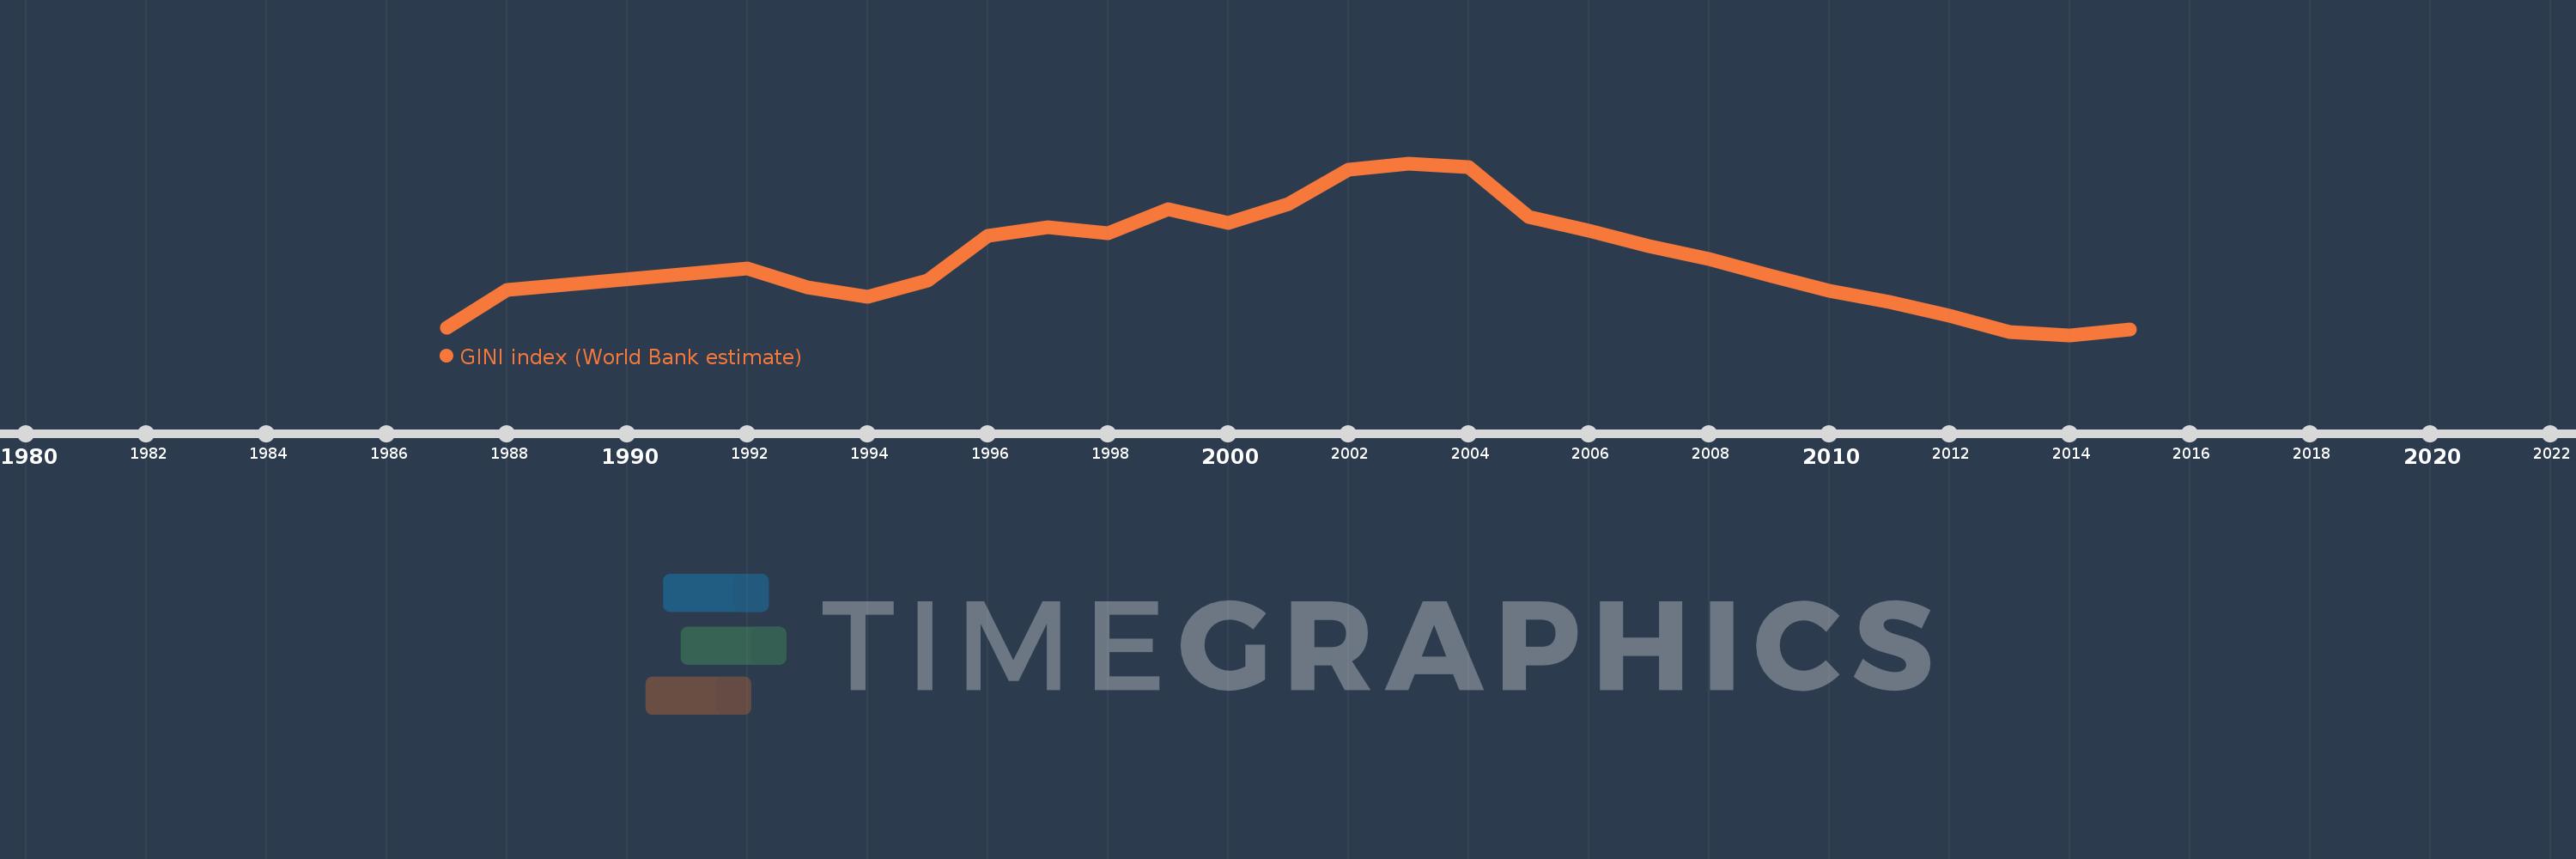
This timeline shows a graph from 1987 to 2015 of Argentina. No data until 1986. Number of actual observations by date: 26.
Source name:
World Development Indicators
Source organization:
World Bank, Development Research Group. Data are based on primary household survey data obtained from government statistical agencies and World Bank country departments. For more information and methodology, please see PovcalNet (http://iresearch.worldbank.org/PovcalNet/index.htm).
Categories, topics:
Poverty
Last updated:
apr 23, 2017
Indicators value changes by year
Meaning:
47.423
Minimum:
42.28
jan 1, 2014
Maximum:
53.79
jan 1, 2003
At the date of observation
Value
Absolute change
Change from the previous value
jan 1, 1987
42.79
+42.79
0.0%
jan 1, 1988
45.28
+2.49
5.82%
jan 1, 1992
46.76
+1.48
3.27%
jan 1, 1993
45.47
-1.29
-2.76%
jan 1, 1994
44.86
-0.61
-1.34%
jan 1, 1995
45.92
+1.06
2.36%
jan 1, 1996
48.9
+2.98
6.49%
jan 1, 1997
49.52
+0.62
1.27%
jan 1, 1998
49.11
-0.41
-0.83%
jan 1, 1999
50.73
+1.62
3.3%
jan 1, 2000
49.79
-0.94
-1.85%
jan 1, 2001
51.06
+1.27
2.55%
jan 1, 2002
53.34
+2.28
4.47%
jan 1, 2003
53.79
+0.45
0.84%
jan 1, 2004
53.54
-0.25
-0.46%
jan 1, 2005
50.18
-3.36
-6.28%
jan 1, 2006
49.27
-0.91
-1.81%
jan 1, 2007
48.26
-1.01
-2.05%
jan 1, 2008
47.37
-0.89
-1.84%
jan 1, 2009
46.27
-1.1
-2.32%
jan 1, 2010
45.27
-1.0
-2.16%
jan 1, 2011
44.5
-0.77
-1.7%
jan 1, 2012
43.57
-0.93
-2.09%
jan 1, 2013
42.49
-1.08
-2.48%
jan 1, 2014
42.28
-0.21
-0.49%
jan 1, 2015
42.67
+0.39
0.92%
Ranking of countries by current statistics by years