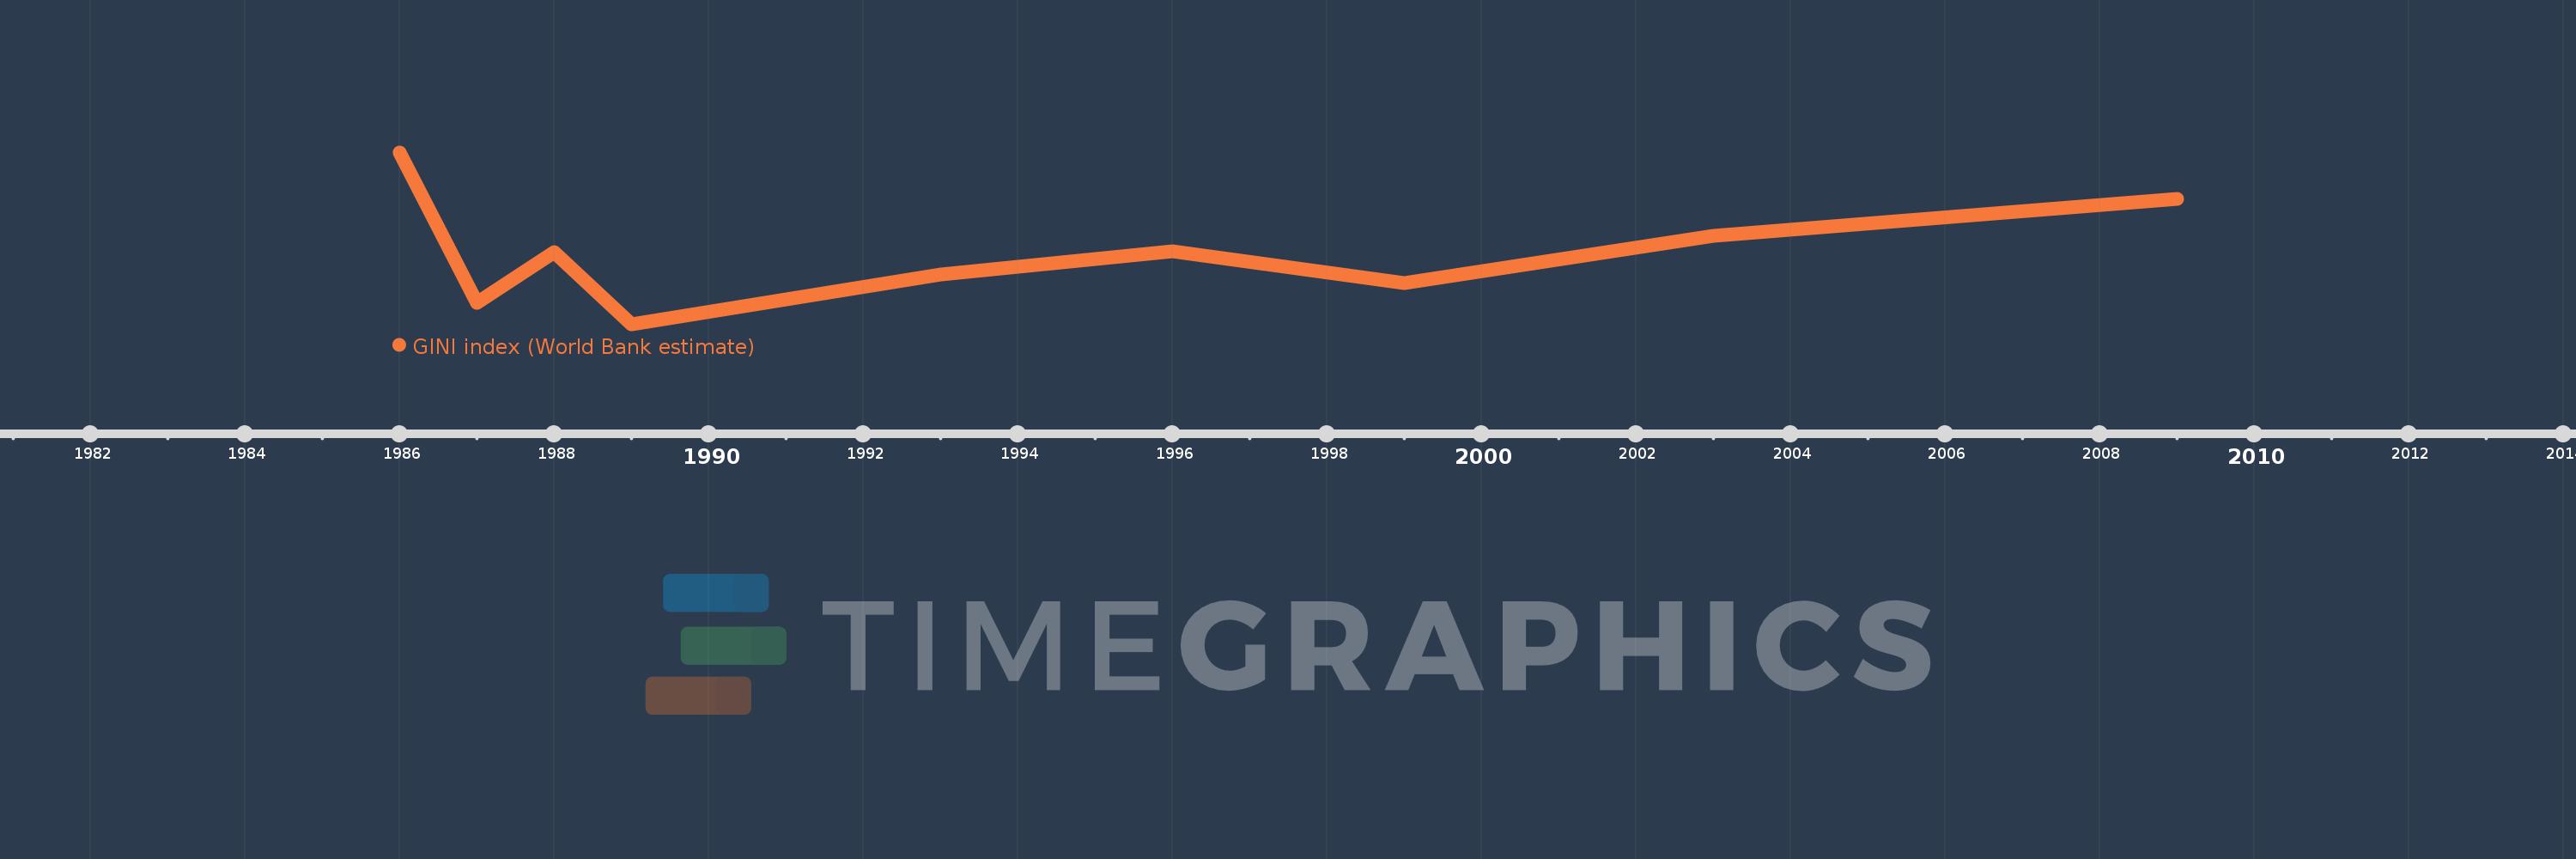
This timeline shows a graph from 1986 to 2009 of Cote d'Ivoire. No data until 1985. Number of actual observations by date: 9.
Source name:
World Development Indicators
Source organization:
World Bank, Development Research Group. Data are based on primary household survey data obtained from government statistical agencies and World Bank country departments. For more information and methodology, please see PovcalNet (http://iresearch.worldbank.org/PovcalNet/index.htm).
Categories, topics:
Poverty
Last updated:
apr 23, 2017
Indicators value changes by year
Meaning:
40.481
Minimum:
36.89
jan 1, 1989
Maximum:
45.53
jan 1, 1986
At the date of observation
Value
Absolute change
Change from the previous value
jan 1, 1986
45.53
+45.53
0.0%
jan 1, 1987
37.97
-7.56
-16.6%
jan 1, 1988
40.51
+2.54
6.69%
jan 1, 1989
36.89
-3.62
-8.94%
jan 1, 1993
39.39
+2.5
6.78%
jan 1, 1996
40.56
+1.17
2.97%
jan 1, 1999
38.96
-1.6
-3.94%
jan 1, 2003
41.34
+2.38
6.11%
jan 1, 2009
43.18
+1.84
4.45%
Ranking of countries by current statistics by years