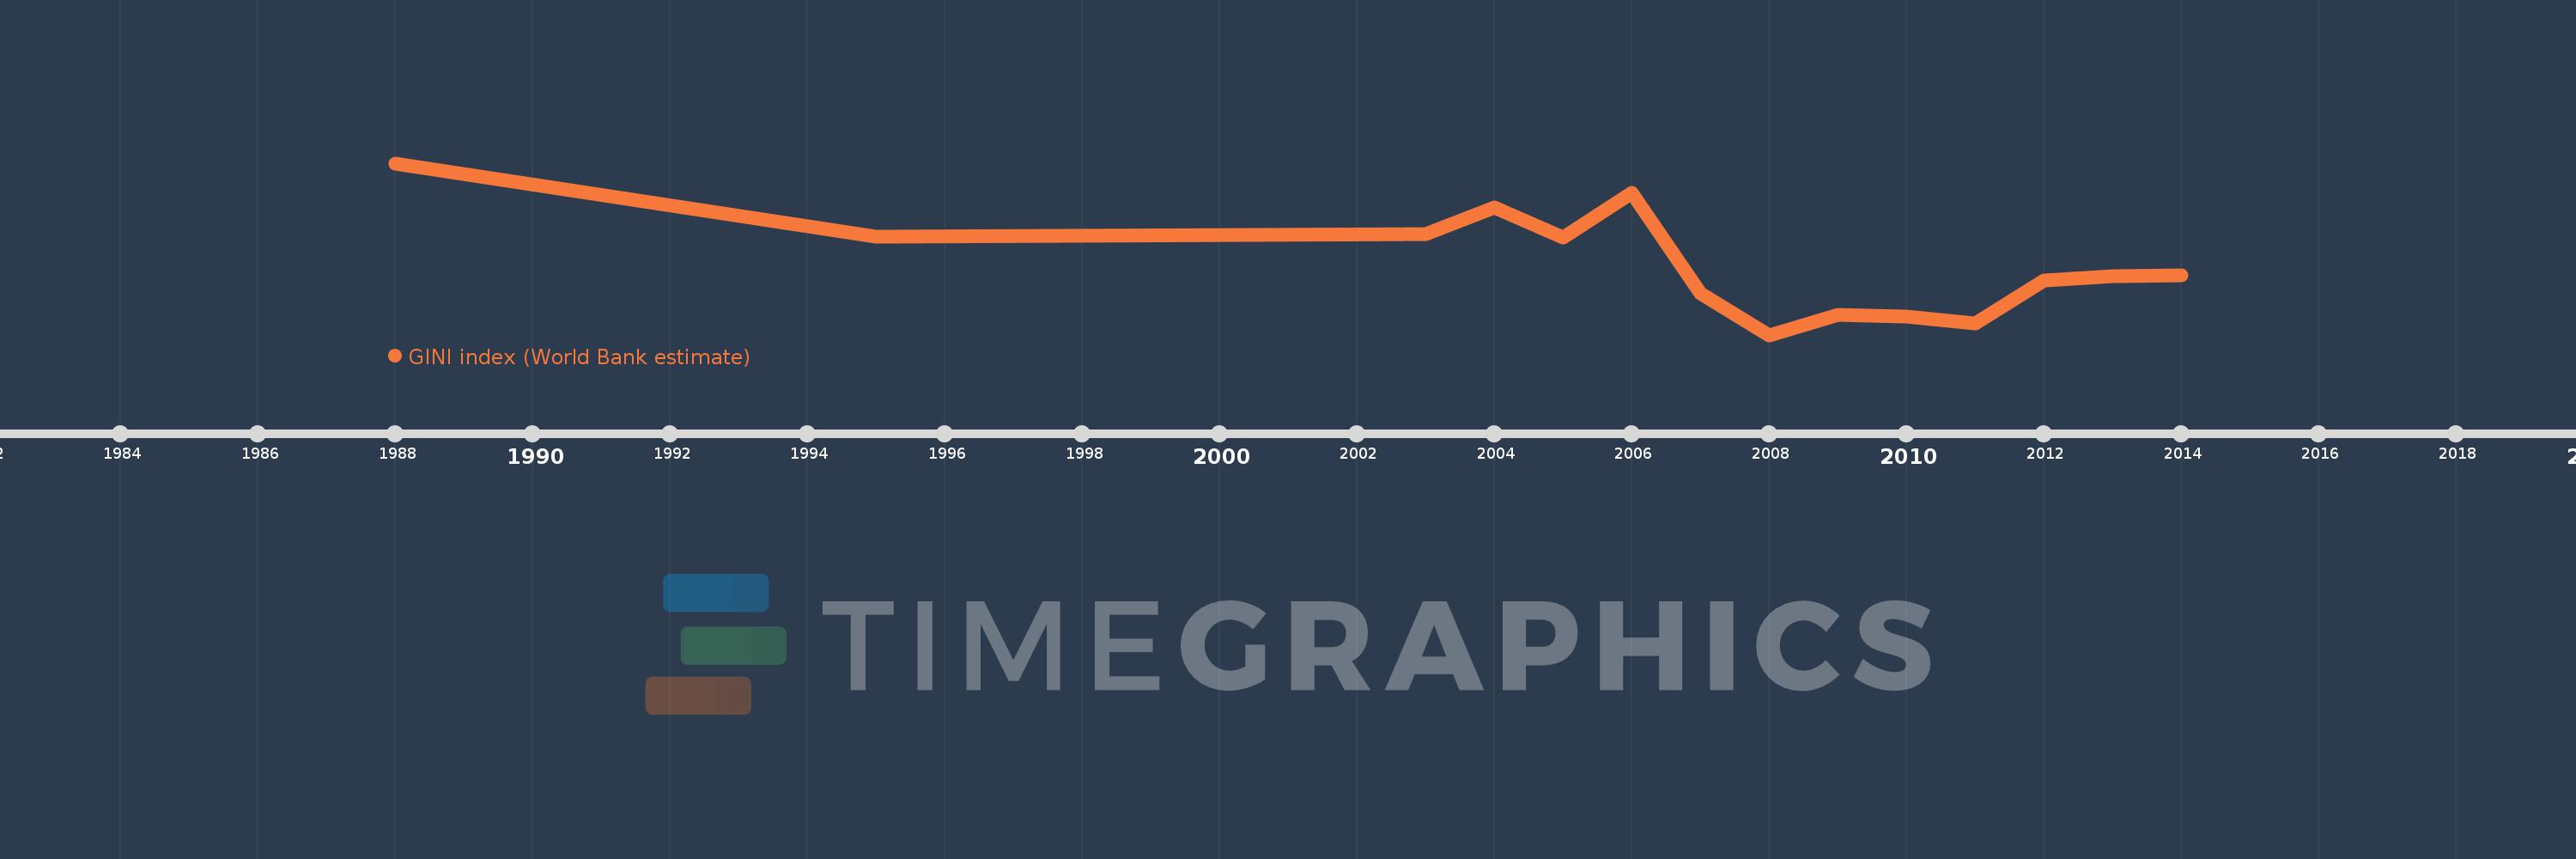
This timeline shows a graph from 1988 to 2014 of Turkey. No data until 1987. Number of actual observations by date: 14.
Source name:
World Development Indicators
Source organization:
World Bank, Development Research Group. Data are based on primary household survey data obtained from government statistical agencies and World Bank country departments. For more information and methodology, please see PovcalNet (http://iresearch.worldbank.org/PovcalNet/index.htm).
Categories, topics:
Poverty
Last updated:
apr 23, 2017
Indicators value changes by year
Meaning:
40.539
Minimum:
38.44
jan 1, 2008
Maximum:
43.48
jan 1, 1988
At the date of observation
Value
Absolute change
Change from the previous value
jan 1, 1988
43.48
+43.48
0.0%
jan 1, 1995
41.32
-2.16
-4.97%
jan 1, 2003
41.4
+0.08
0.19%
jan 1, 2004
42.18
+0.78
1.88%
jan 1, 2005
41.29
-0.89
-2.11%
jan 1, 2006
42.61
+1.32
3.2%
jan 1, 2007
39.65
-2.96
-6.95%
jan 1, 2008
38.44
-1.21
-3.05%
jan 1, 2009
39.02
+0.58
1.51%
jan 1, 2010
38.97
-0.05
-0.13%
jan 1, 2011
38.79
-0.18
-0.46%
jan 1, 2012
40.04
+1.25
3.22%
jan 1, 2013
40.17
+0.13
0.32%
jan 1, 2014
40.18
+0.01
0.02%
Ranking of countries by current statistics by years