Download This statistics in other country:
Timeline:
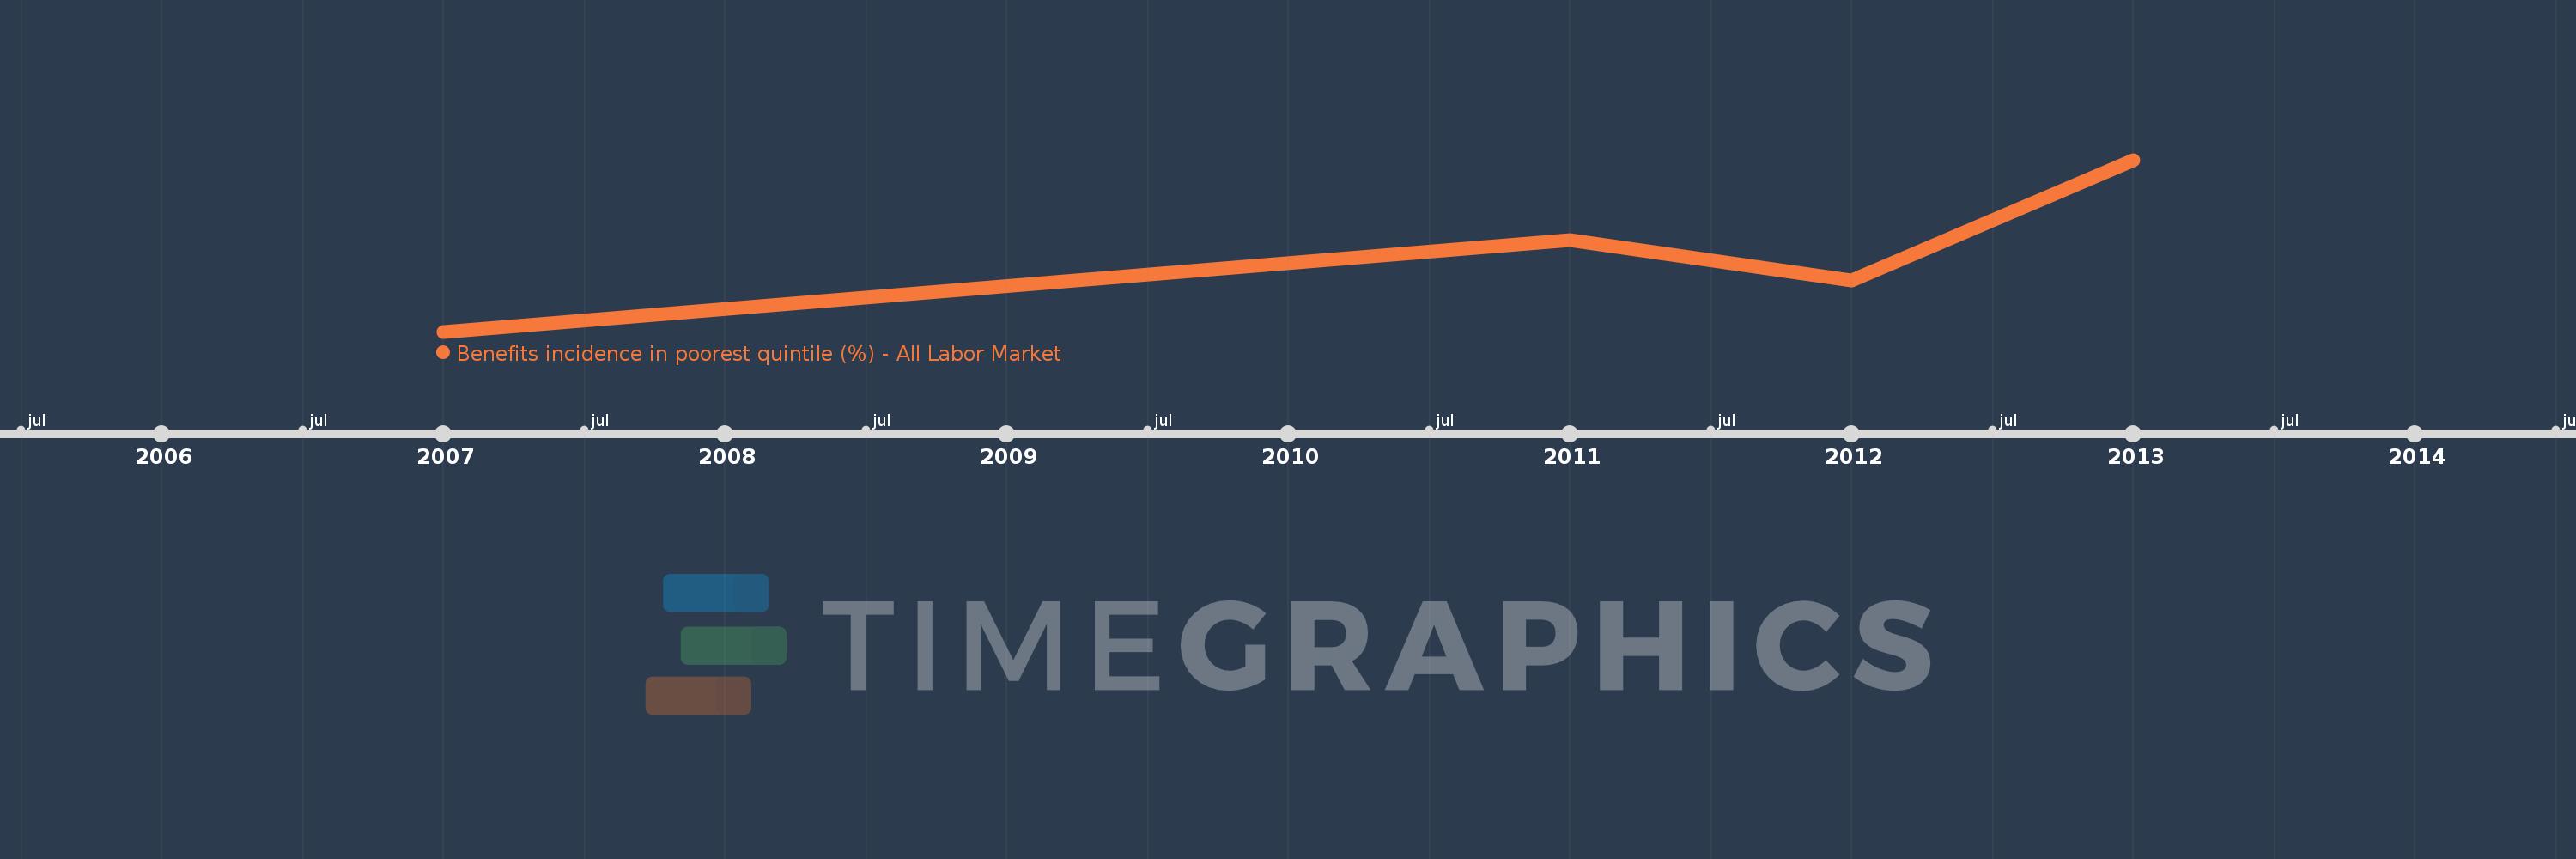
This timeline shows a graph from 2007 to 2013 of Argentina. No data until 2006. Number of actual observations by date: 4.
Source name:
World Development Indicators
Source organization:
The Atlas of Social Protection: Indicators of Resilience and Equity (ASPIRE)
Categories, topics:
Social Protection & Labor
Last updated:
apr 23, 2017
Indicators value changes by year
Minimum:
13.652
jan 1, 2007
Maximum:
28.883
jan 1, 2013
At the date of observation
Value
Absolute change
Change from the previous value
jan 1, 2007
13.652
+13.652
0.0%
jan 1, 2011
21.777
+8.125
59.51%
jan 1, 2012
18.173
-3.604
-16.55%
jan 1, 2013
28.883
+10.711
58.94%
Ranking of countries by current statistics by years