Download This statistics in other country:
Timeline:
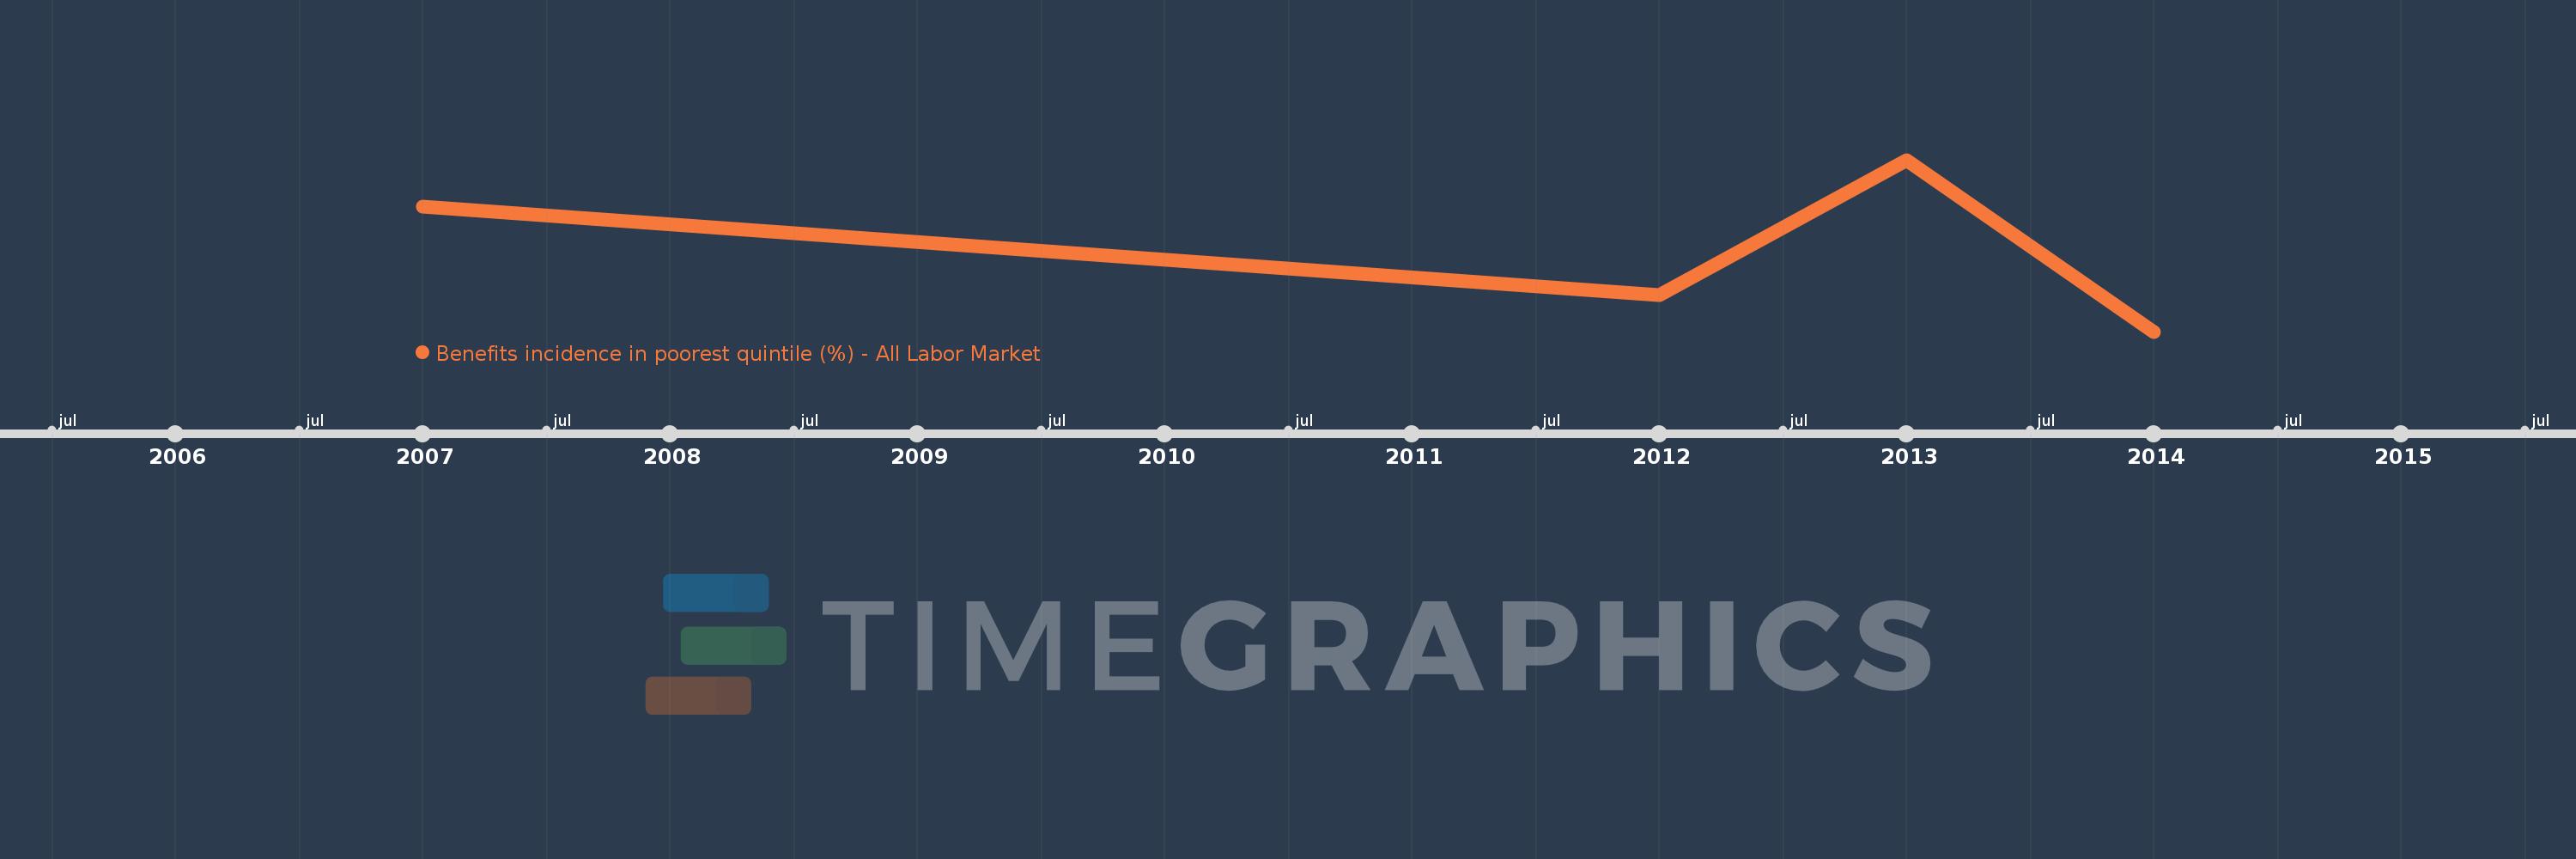
This timeline shows a graph from 2007 to 2014 of Ukraine. No data until 2006. Number of actual observations by date: 4.
Source name:
World Development Indicators
Source organization:
The Atlas of Social Protection: Indicators of Resilience and Equity (ASPIRE)
Categories, topics:
Social Protection & Labor
Last updated:
apr 23, 2017
Indicators value changes by year
Minimum:
14.432
jan 1, 2014
At the date of observation
Value
Absolute change
Change from the previous value
jan 1, 2007
25.79
+25.79
0.0%
jan 1, 2012
17.777
-8.014
-31.07%
jan 1, 2013
30.05
+12.273
69.04%
jan 1, 2014
14.432
-15.618
-51.97%
Ranking of countries by current statistics by years