Download This statistics in other country:
Timeline:
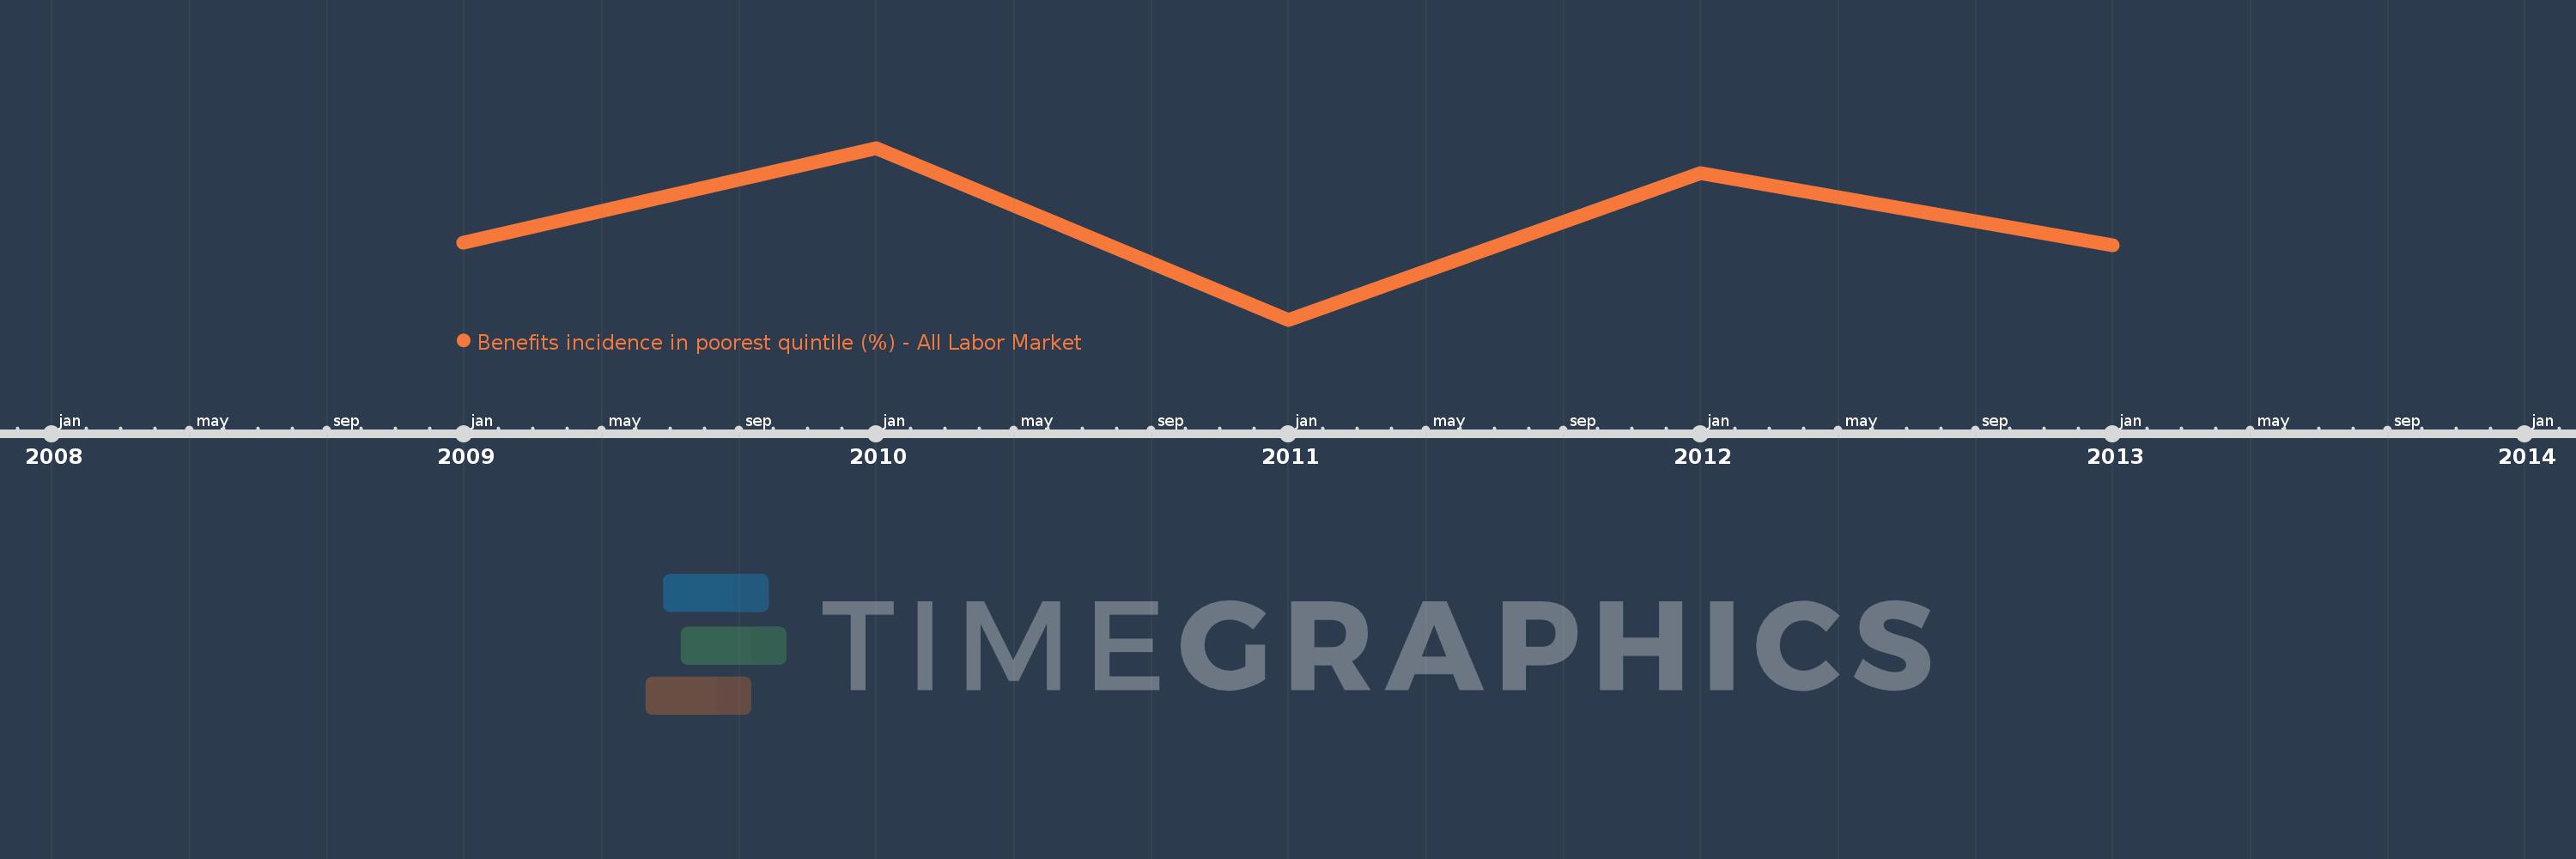
This timeline shows a graph from 2009 to 2013 of Uruguay. No data until 2008. Number of actual observations by date: 5.
Source name:
World Development Indicators
Source organization:
The Atlas of Social Protection: Indicators of Resilience and Equity (ASPIRE)
Categories, topics:
Social Protection & Labor
Last updated:
apr 23, 2017
Indicators value changes by year
Minimum:
11.543
jan 1, 2011
At the date of observation
Value
Absolute change
Change from the previous value
jan 1, 2009
14.325
+14.325
0.0%
jan 1, 2010
17.72
+3.396
23.7%
jan 1, 2011
11.543
-6.177
-34.86%
jan 1, 2012
16.825
+5.282
45.76%
jan 1, 2013
14.22
-2.605
-15.48%
Ranking of countries by current statistics by years