30
/
AIzaSyAYiBZKx7MnpbEhh9jyipgxe19OcubqV5w
April 1, 2024
62893
World
WLD
false
2
1
Net official flows from UN agencies, WHO (current US$)
2015,2014,2013,2012,2011,2010
Download
Global statistics library →World →

Net official flows from UN agencies, WHO (current US$)

This statistics in other country:

AfghanistanAlbaniaAlgeriaAngolaArab WorldArmeniaAzerbaijanBangladeshBelarusBeninBhutanBosnia and HerzegovinaBotswanaBurkina FasoBurundiCabo VerdeCambodiaCameroonCentral African RepublicChadChinaComorosCongo, Dem. Rep.Congo, Rep.Cote d'IvoireDjiboutiEast Asia & PacificEast Asia & Pacific (excluding high income)East Asia & Pacific (IDA & IBRD countries)Egypt, Arab Rep.Equatorial GuineaEritreaEthiopiaEurope & Central AsiaEurope & Central Asia (excluding high income)Europe & Central Asia (IDA & IBRD countries)FijiFragile and conflict affected situationsGabonGambia, TheGeorgiaGhanaGuineaGuinea-BissauHeavily indebted poor countries (HIPC)High incomeIBRD onlyIDA & IBRD totalIDA blendIDA onlyIDA totalIndiaIndonesiaIran, Islamic Rep.IraqJordanKazakhstanKenyaKiribatiKorea, Dem. People’s Rep.KosovoKyrgyz RepublicLao PDRLatin America & Caribbean Latin America & Caribbean (excluding high income)Least developed countries: UN classificationLebanonLesothoLiberiaLibyaLow & middle incomeLow incomeLower middle incomeMacedonia, FYRMadagascarMalawiMalaysiaMaldivesMaliMarshall IslandsMauritaniaMauritiusMicronesia, Fed. Sts.Middle East & North AfricaMiddle East & North Africa (excluding high income)Middle East & North Africa (IDA & IBRD countries)Middle incomeMoldovaMongoliaMontenegroMoroccoMozambiqueMyanmarNamibiaNauruNepalNigerNigeriaNorth AmericaOECD membersOther small statesPacific island small statesPakistanPalauPapua New GuineaPhilippinesRwandaSamoaSao Tome and PrincipeSenegalSerbiaSeychellesSierra LeoneSmall statesSolomon IslandsSomaliaSouth AfricaSouth AsiaSouth Asia (IDA & IBRD)South SudanSri LankaSub-Saharan Africa Sub-Saharan Africa (excluding high income)Sub-Saharan Africa (IDA & IBRD countries)SudanSwazilandSyrian Arab RepublicTajikistanTanzaniaThailandTimor-LesteTogoTongaTunisiaTurkeyTurkmenistanTuvaluUgandaUkraineUpper middle incomeUzbekistanVanuatuVietnamWest Bank and GazaWorldYemen, Rep.ZambiaZimbabwe

Timeline:

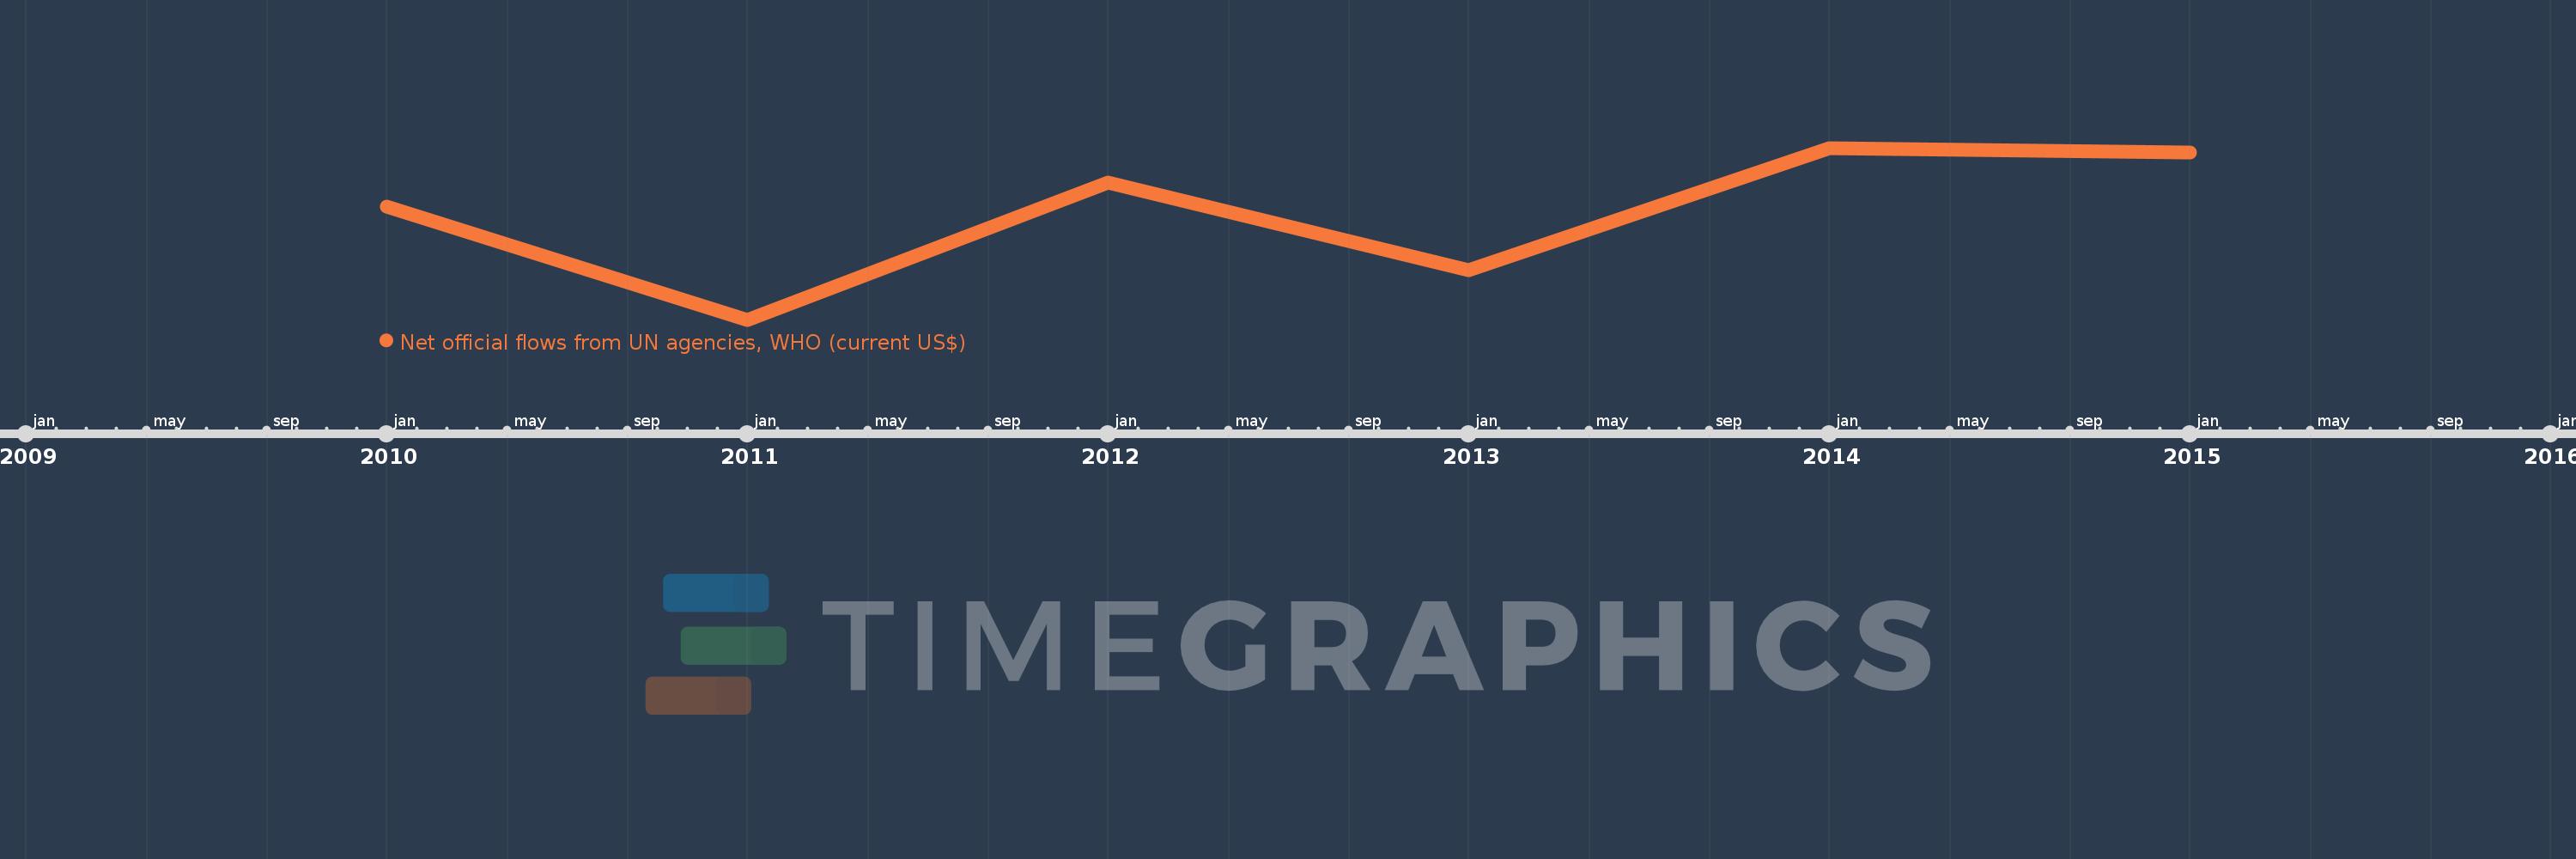
This timeline shows a graph from 2010 to 2015 of World. No data until 2009. Number of actual observations by date: 6.

Source name:

World Development Indicators

Source organization:

Development Assistance Committee of the Organisation for Economic Co-operation and Development, Geographical Distribution of Financial Flows to Developing Countries, Development Co-operation Report, and International Development Statistics database. Data are available online at: www.oecd.org/dac/stats/idsonline.

Categories, topics:

Aid Effectiveness

Last updated:

apr 23, 2017

Indicators value changes by year

Meaning:
432.837 mln
Minimum:
366.24 mln
jan 1, 2011
Maximum:
473.76 mln
jan 1, 2014
At the date of observation
Value
Absolute change
Change from the previous value
jan 1, 2010
436.79 mln
+436.79 mln
0.0%
jan 1, 2011
366.24 mln
-70.55 mln
-16.15%
jan 1, 2012
452.26 mln
+86.02 mln
23.49%
jan 1, 2013
397.0 mln
-55.26 mln
-12.22%
jan 1, 2014
473.76 mln
+76.76 mln
19.34%
jan 1, 2015
470.97 mln
-2.79 mln
-0.59%

Ranking of countries by current statistics by years