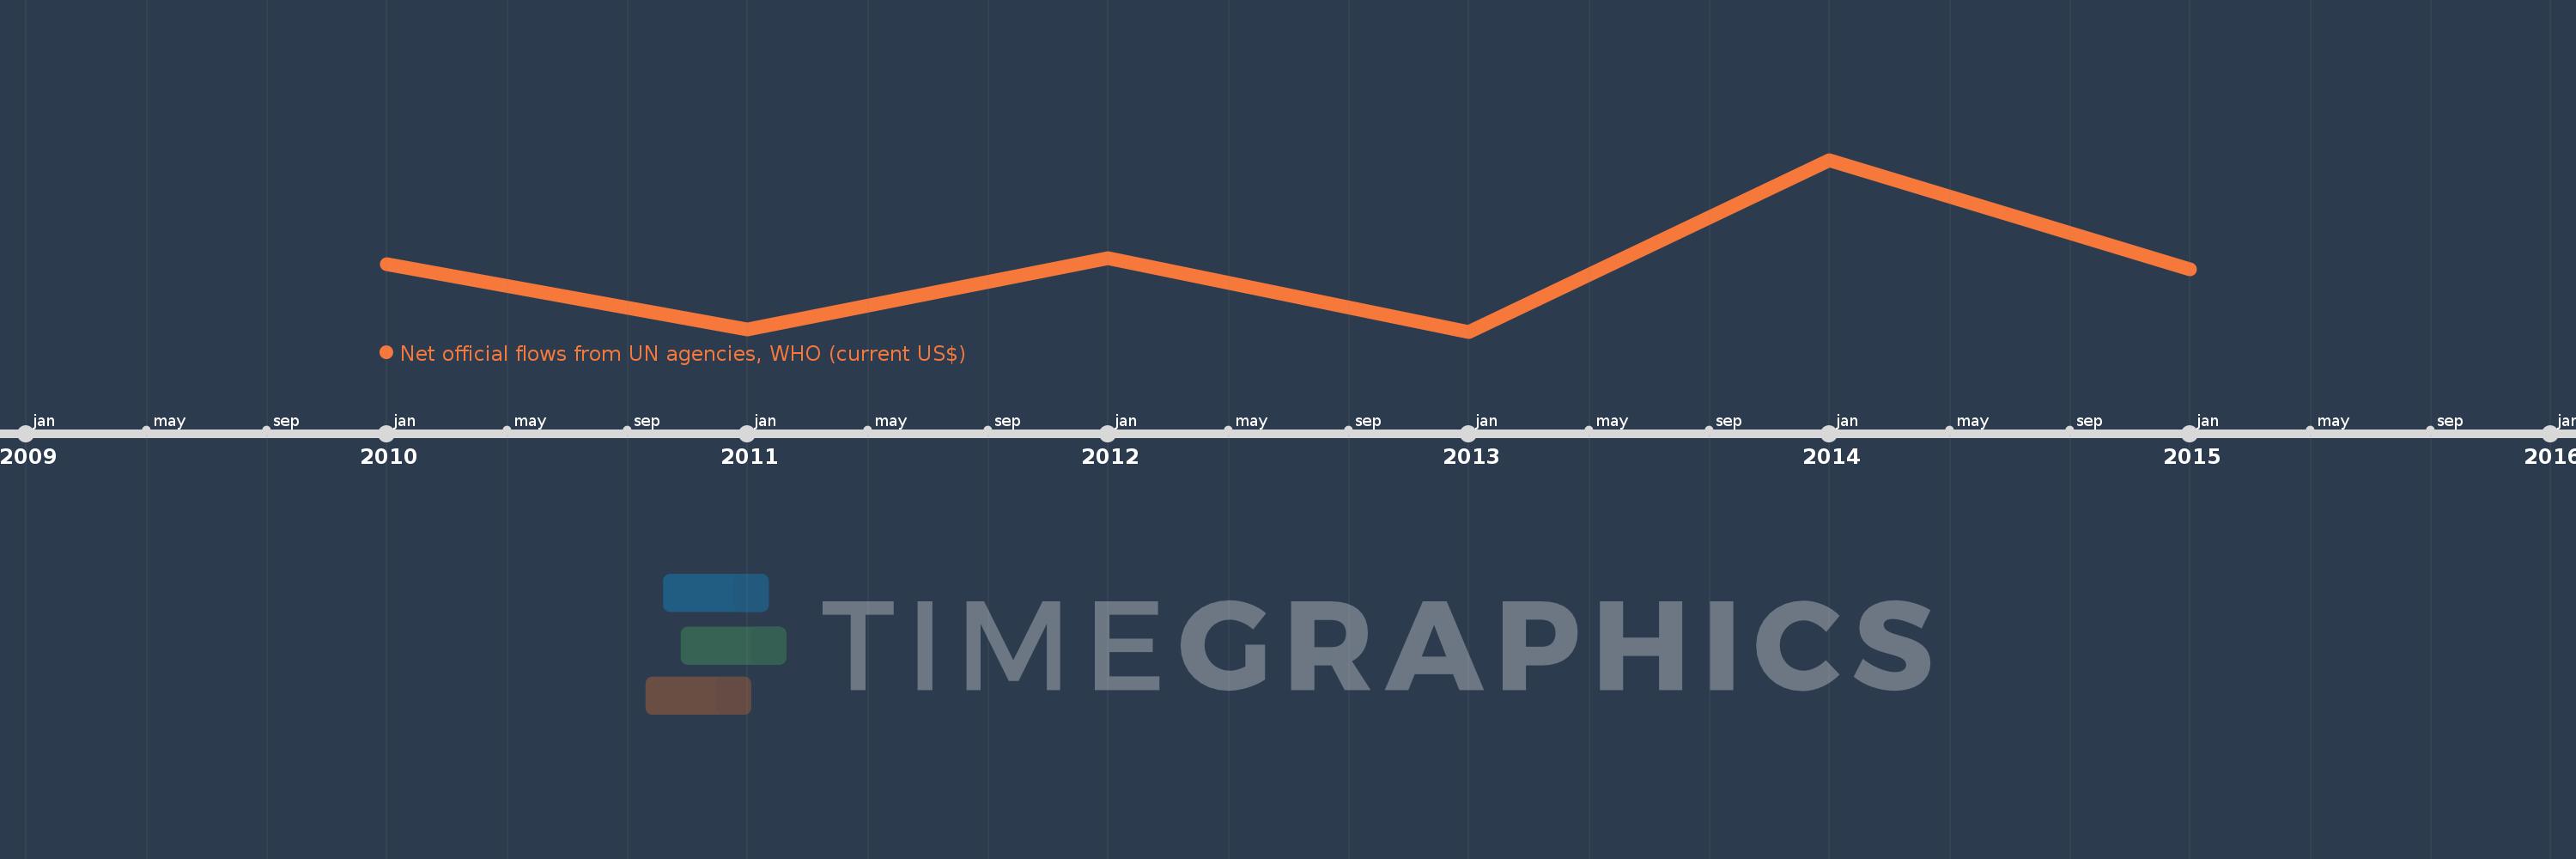
This timeline shows a graph from 2010 to 2015 of Sub-Saharan Africa (excluding high income). No data until 2009. Number of actual observations by date: 6.
Source name:
World Development Indicators
Source organization:
Development Assistance Committee of the Organisation for Economic Co-operation and Development, Geographical Distribution of Financial Flows to Developing Countries, Development Co-operation Report, and International Development Statistics database. Data are available online at: www.oecd.org/dac/stats/idsonline.
Categories, topics:
Aid Effectiveness
Last updated:
apr 23, 2017
Indicators value changes by year
Meaning:
102.662 mln
Minimum:
89.38 mln
jan 1, 2013
Maximum:
125.74 mln
jan 1, 2014
At the date of observation
Value
Absolute change
Change from the previous value
jan 1, 2010
103.62 mln
+103.62 mln
0.0%
jan 1, 2011
89.76 mln
-13.86 mln
-13.38%
jan 1, 2012
104.93 mln
+15.17 mln
16.9%
jan 1, 2013
89.38 mln
-15.55 mln
-14.82%
jan 1, 2014
125.74 mln
+36.36 mln
40.68%
jan 1, 2015
102.54 mln
-23.2 mln
-18.45%
Ranking of countries by current statistics by years