Download This statistics in other country:
Timeline:
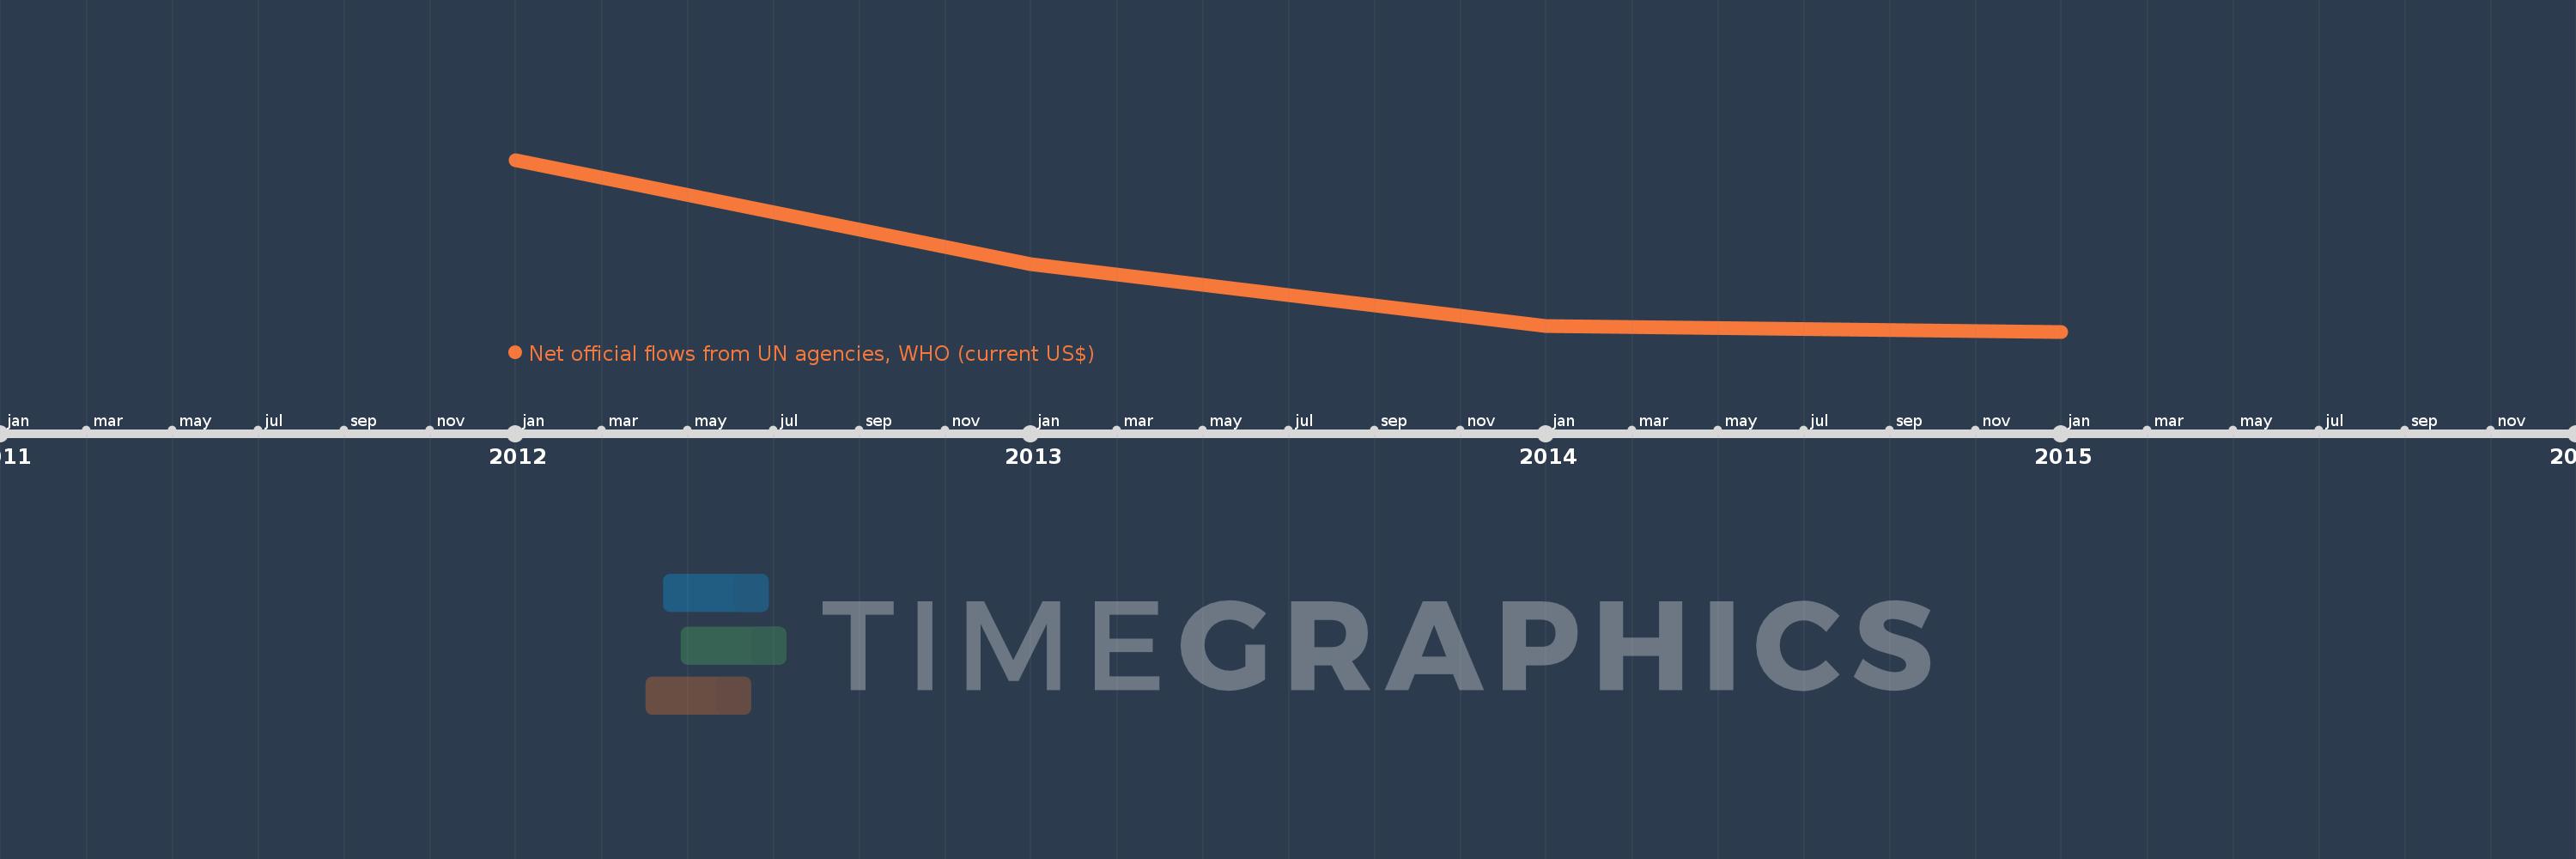
This timeline shows a graph from 2012 to 2015 of Syrian Arab Republic. No data until 2011. Number of actual observations by date: 4.
Source name:
World Development Indicators
Source organization:
Development Assistance Committee of the Organisation for Economic Co-operation and Development, Geographical Distribution of Financial Flows to Developing Countries, Development Co-operation Report, and International Development Statistics database. Data are available online at: www.oecd.org/dac/stats/idsonline.
Categories, topics:
Aid Effectiveness
Last updated:
apr 23, 2017
Indicators value changes by year
Minimum:
400.0K
jan 1, 2015
Maximum:
1.01 mln
jan 1, 2012
At the date of observation
Value
Absolute change
Change from the previous value
jan 1, 2012
1.01 mln
+1.01 mln
0.0%
jan 1, 2013
640.0K
-370.0K
-36.63%
jan 1, 2014
420.0K
-220.0K
-34.38%
jan 1, 2015
400.0K
-20.0K
-4.76%
Ranking of countries by current statistics by years