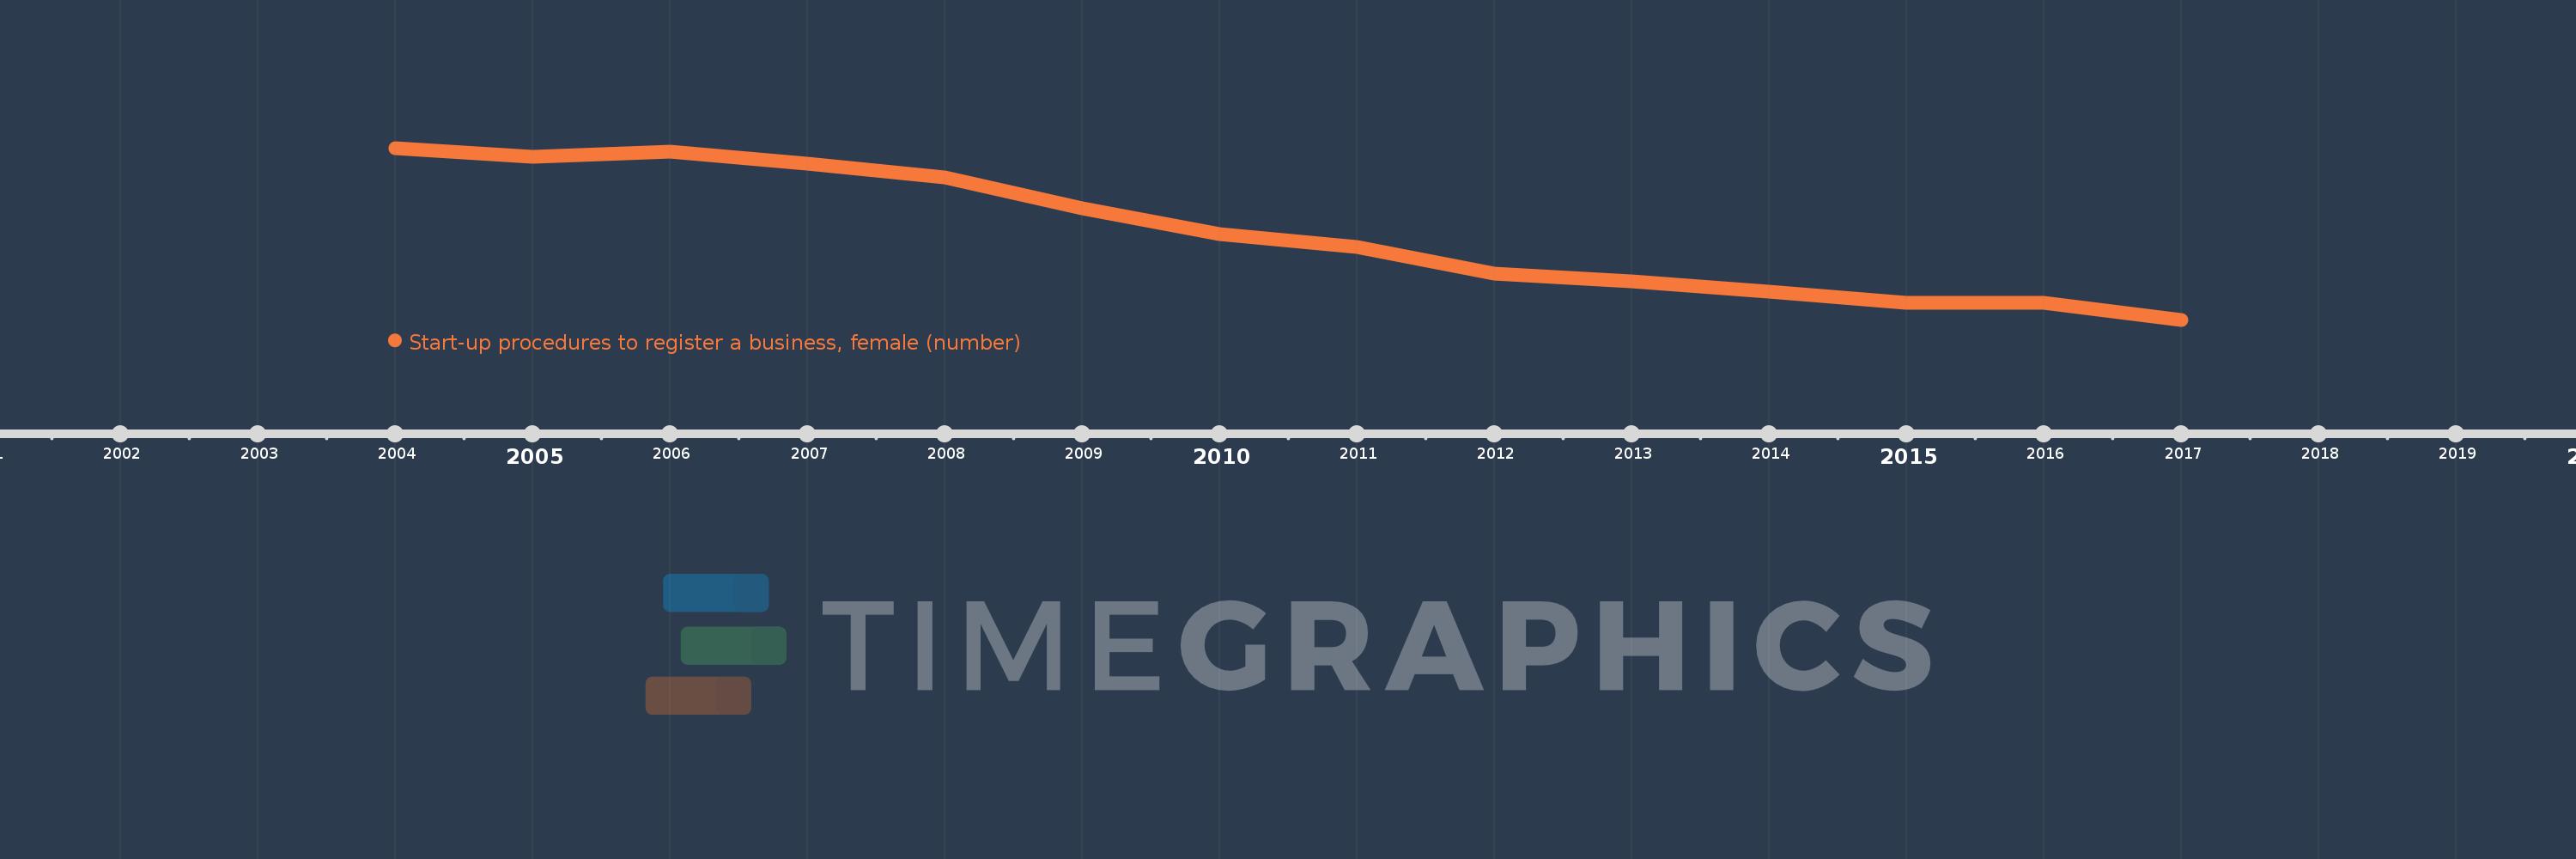
This timeline shows a graph from 2004 to 2017 of Sub-Saharan Africa (IDA & IBRD countries). No data until 2003. Number of actual observations by date: 14.
Source name:
World Development Indicators
Source organization:
World Bank, Doing Business project (http://www.doingbusiness.org/).
Categories, topics:
Private Sector
Last updated:
apr 23, 2017
Indicators value changes by year
Meaning:
9.628
Minimum:
7.91
jan 1, 2017
Maximum:
11.303
jan 1, 2004
At the date of observation
Value
Absolute change
Change from the previous value
jan 1, 2004
11.303
+11.303
0.0%
jan 1, 2005
11.135
-0.168
-1.49%
jan 1, 2006
11.222
+0.087
0.78%
jan 1, 2007
11.0
-0.222
-1.98%
jan 1, 2008
10.717
-0.283
-2.57%
jan 1, 2009
10.109
-0.609
-5.68%
jan 1, 2010
9.609
-0.5
-4.95%
jan 1, 2011
9.348
-0.261
-2.71%
jan 1, 2012
8.826
-0.522
-5.58%
jan 1, 2013
8.66
-0.167
-1.89%
jan 1, 2014
8.462
-0.198
-2.29%
jan 1, 2015
8.249
-0.213
-2.51%
jan 1, 2016
8.244
-0.005
-0.06%
jan 1, 2017
7.91
-0.333
-4.04%
Ranking of countries by current statistics by years