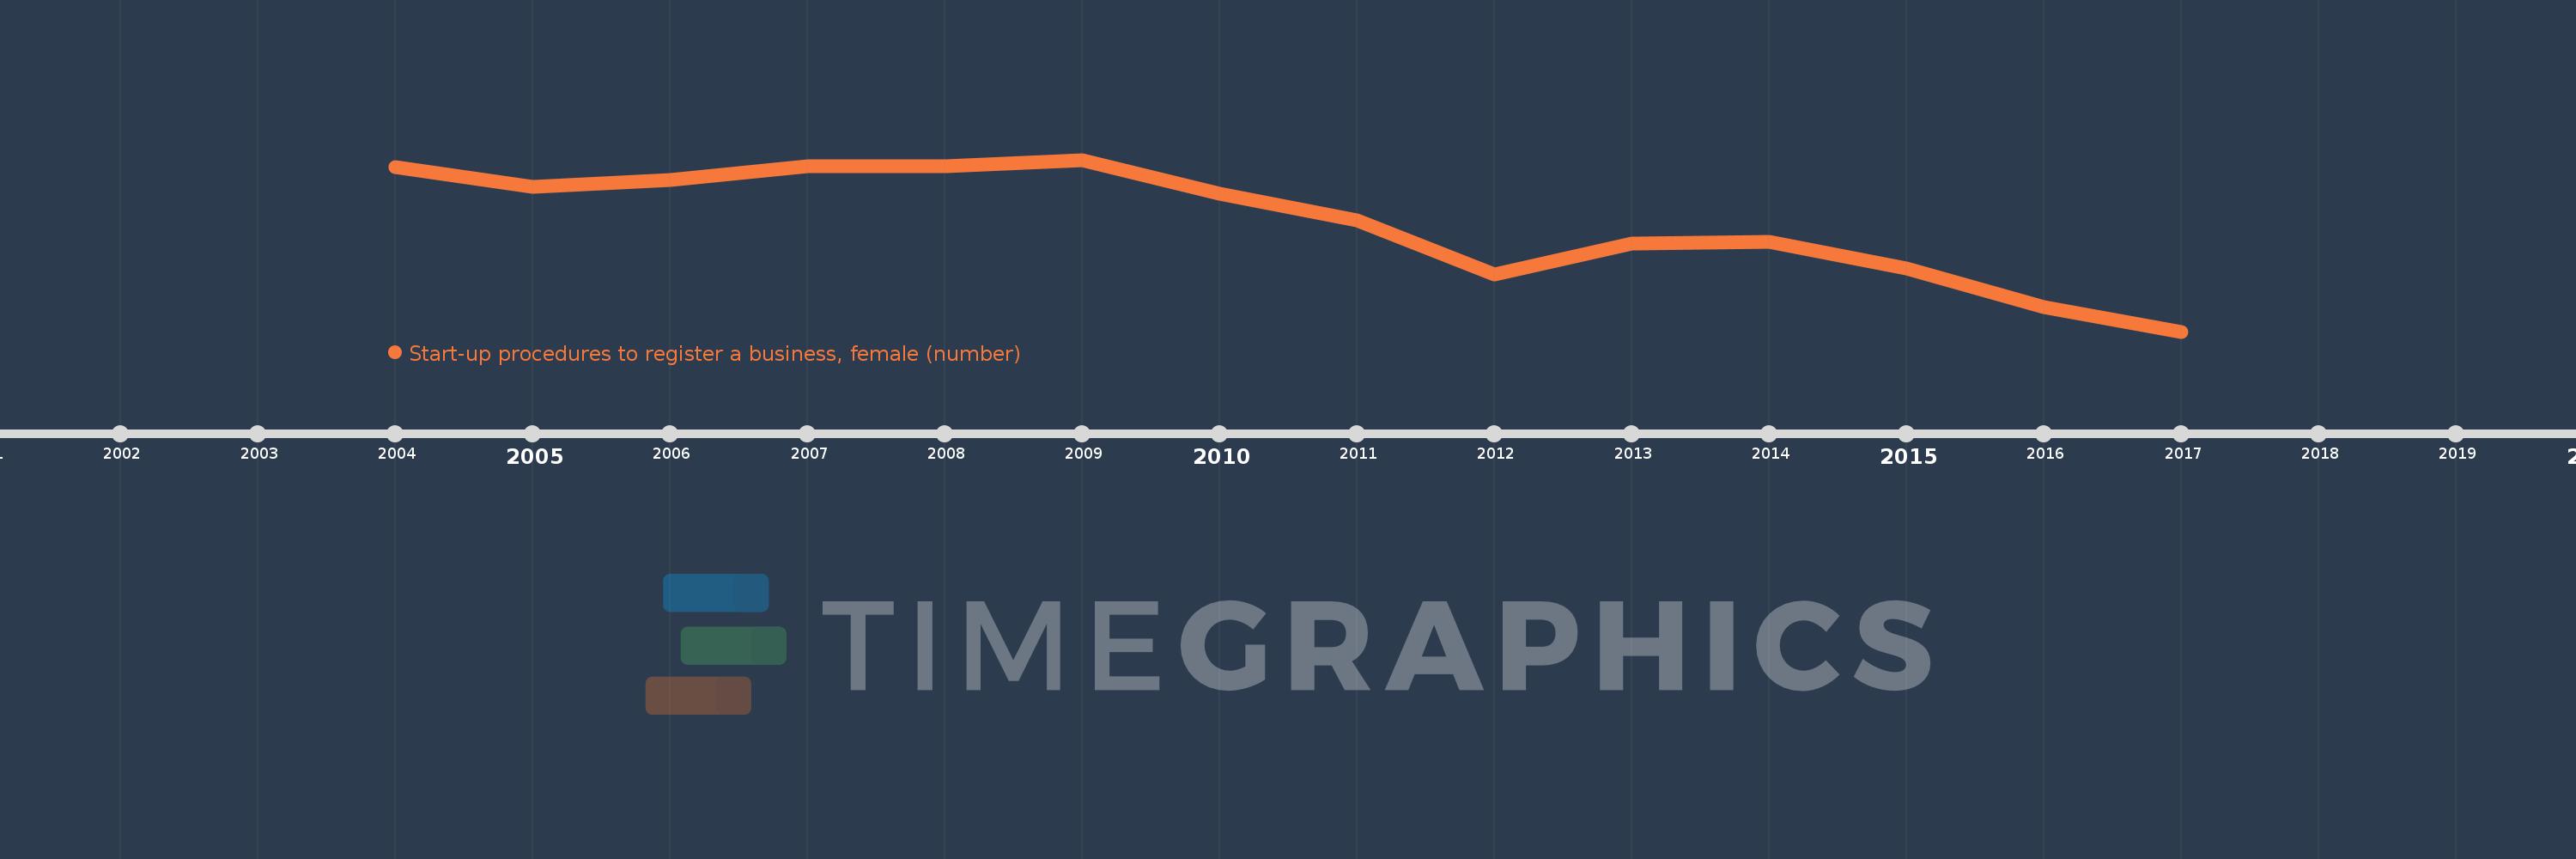
This timeline shows a graph from 2004 to 2017 of East Asia & Pacific (excluding high income). No data until 2003. Number of actual observations by date: 14.
Source name:
World Development Indicators
Source organization:
World Bank, Doing Business project (http://www.doingbusiness.org/).
Categories, topics:
Private Sector
Last updated:
apr 23, 2017
Indicators value changes by year
Meaning:
8.538
Minimum:
7.724
jan 1, 2017
Maximum:
9.0
jan 1, 2009
At the date of observation
Value
Absolute change
Change from the previous value
jan 1, 2004
8.947
+8.947
0.0%
jan 1, 2005
8.8
-0.147
-1.65%
jan 1, 2006
8.85
+0.05
0.57%
jan 1, 2007
8.95
+0.1
1.13%
jan 1, 2008
8.95
0.0
0.0%
jan 1, 2009
9.0
+0.05
0.56%
jan 1, 2010
8.75
-0.25
-2.78%
jan 1, 2011
8.55
-0.2
-2.29%
jan 1, 2012
8.15
-0.4
-4.68%
jan 1, 2013
8.381
+0.231
2.83%
jan 1, 2014
8.39
+0.01
0.11%
jan 1, 2015
8.19
-0.2
-2.38%
jan 1, 2016
7.905
-0.286
-3.49%
jan 1, 2017
7.724
-0.181
-2.29%
Ranking of countries by current statistics by years