33
/
AIzaSyB4mHJ5NPEv-XzF7P6NDYXjlkCWaeKw5bc
November 30, 2025
43023
Latin America & Caribbean (excluding high income)
LAC
false
2
1
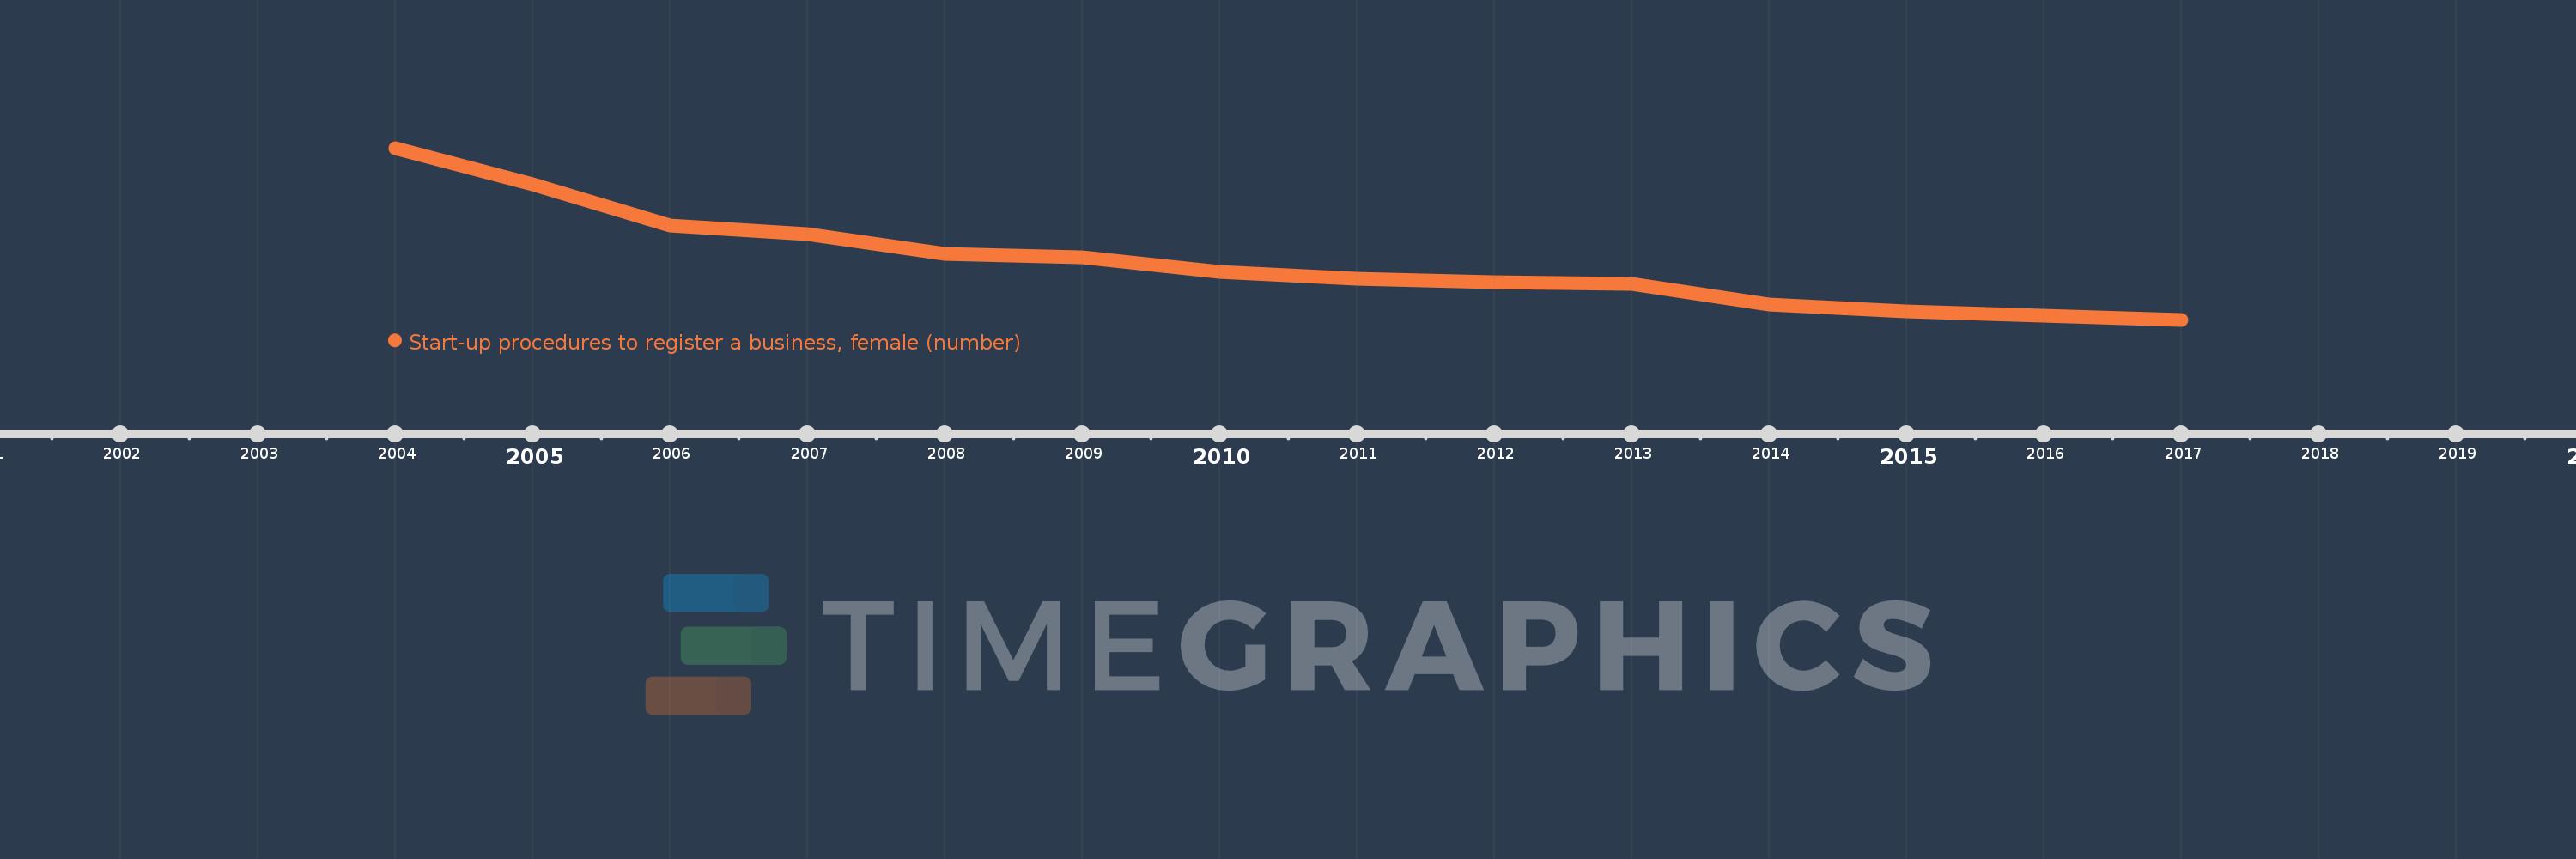
Start-up procedures to register a business, female (number)
2017,2016,2015,2014,2013,2012,2011,2010,2009,2008,2007,2006,2005,2004