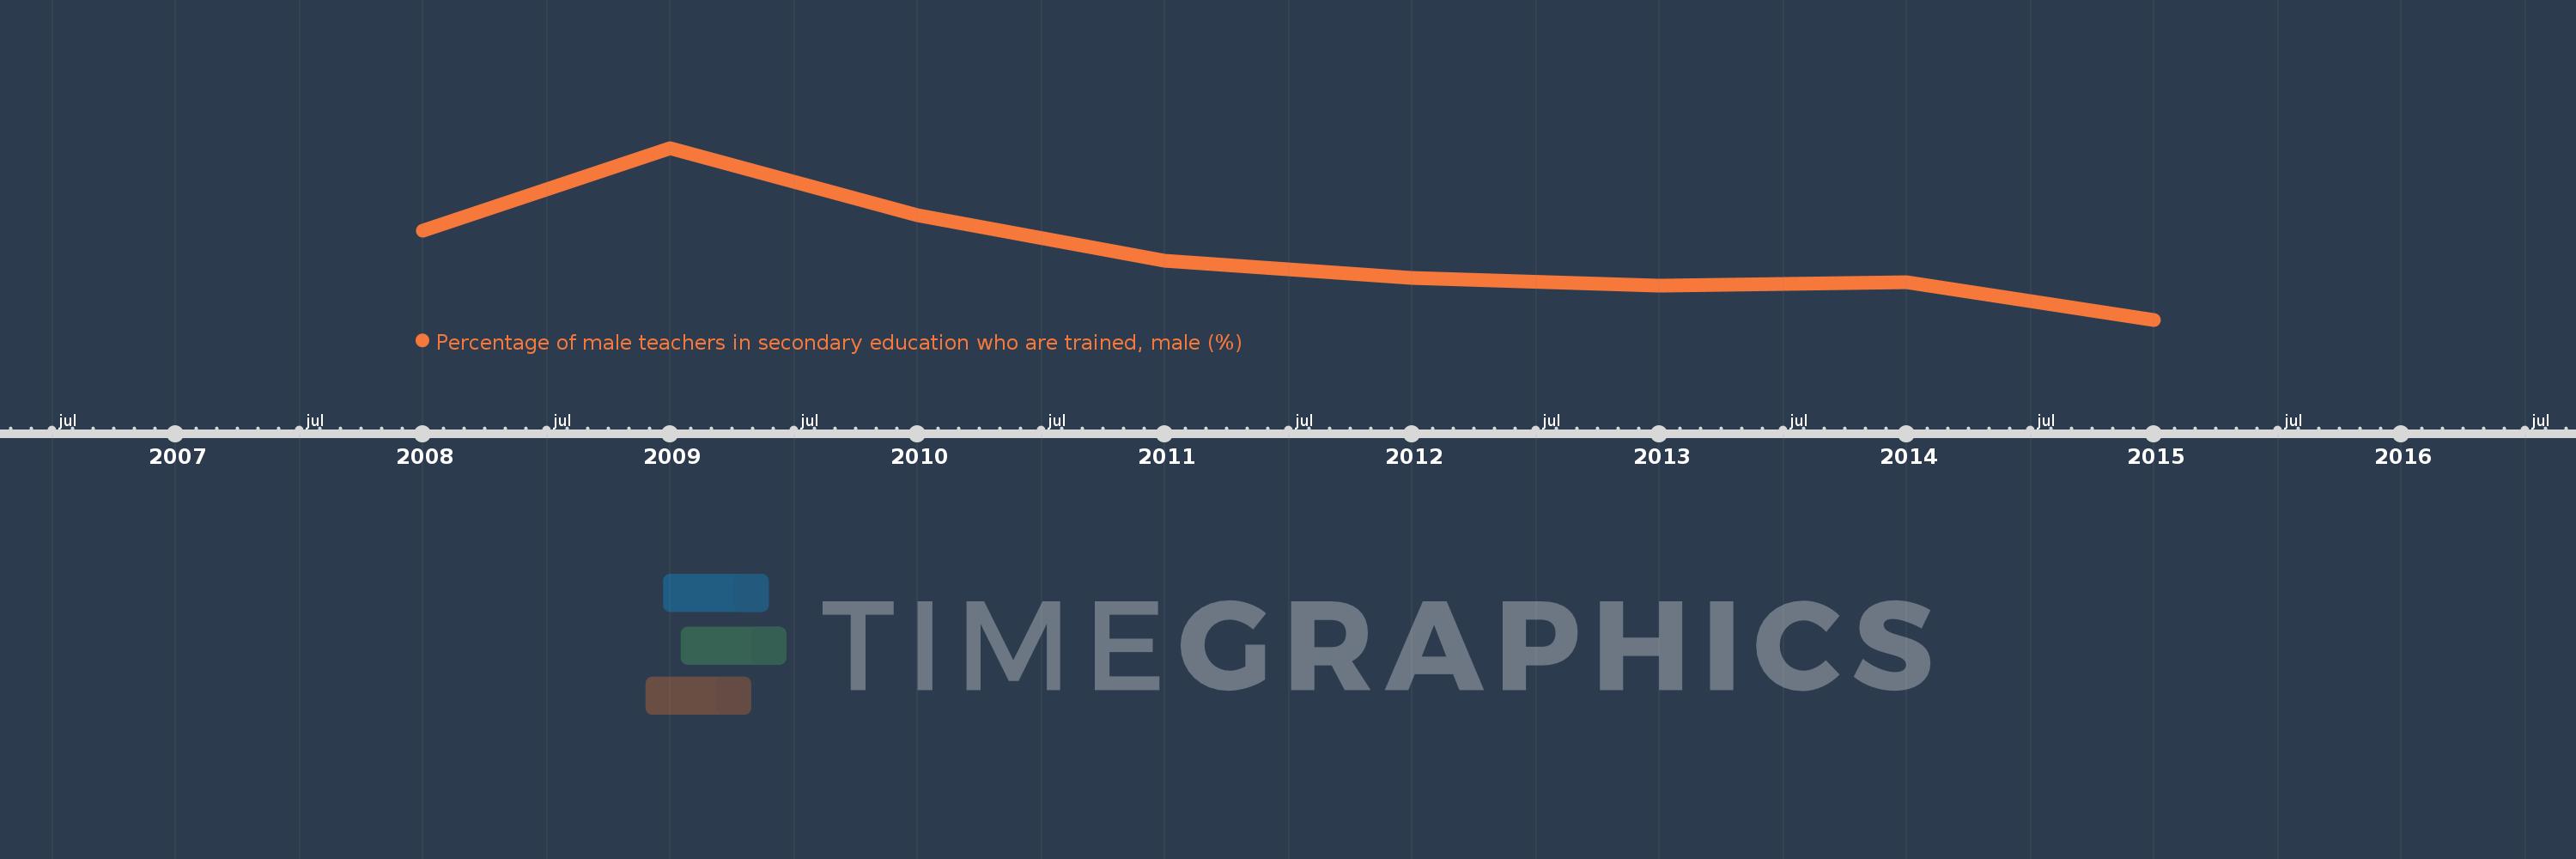
This timeline shows a graph from 2008 to 2015 of Sub-Saharan Africa (IDA & IBRD countries). No data until 2007. Number of actual observations by date: 8.
Source name:
World Development Indicators
Source organization:
UNESCO Institute for Statistics
Categories, topics:
Education
Last updated:
apr 23, 2017
Indicators value changes by year
Meaning:
58.121
Minimum:
52.612
jan 1, 2015
Maximum:
66.676
jan 1, 2009
At the date of observation
Value
Absolute change
Change from the previous value
jan 1, 2008
59.874
+59.874
0.0%
jan 1, 2009
66.676
+6.802
11.36%
jan 1, 2010
61.179
-5.497
-8.24%
jan 1, 2011
57.451
-3.728
-6.09%
jan 1, 2012
56.051
-1.4
-2.44%
jan 1, 2013
55.437
-0.614
-1.09%
jan 1, 2014
55.691
+0.253
0.46%
jan 1, 2015
52.612
-3.079
-5.53%
Ranking of countries by current statistics by years