Download This statistics in other country:
Timeline:
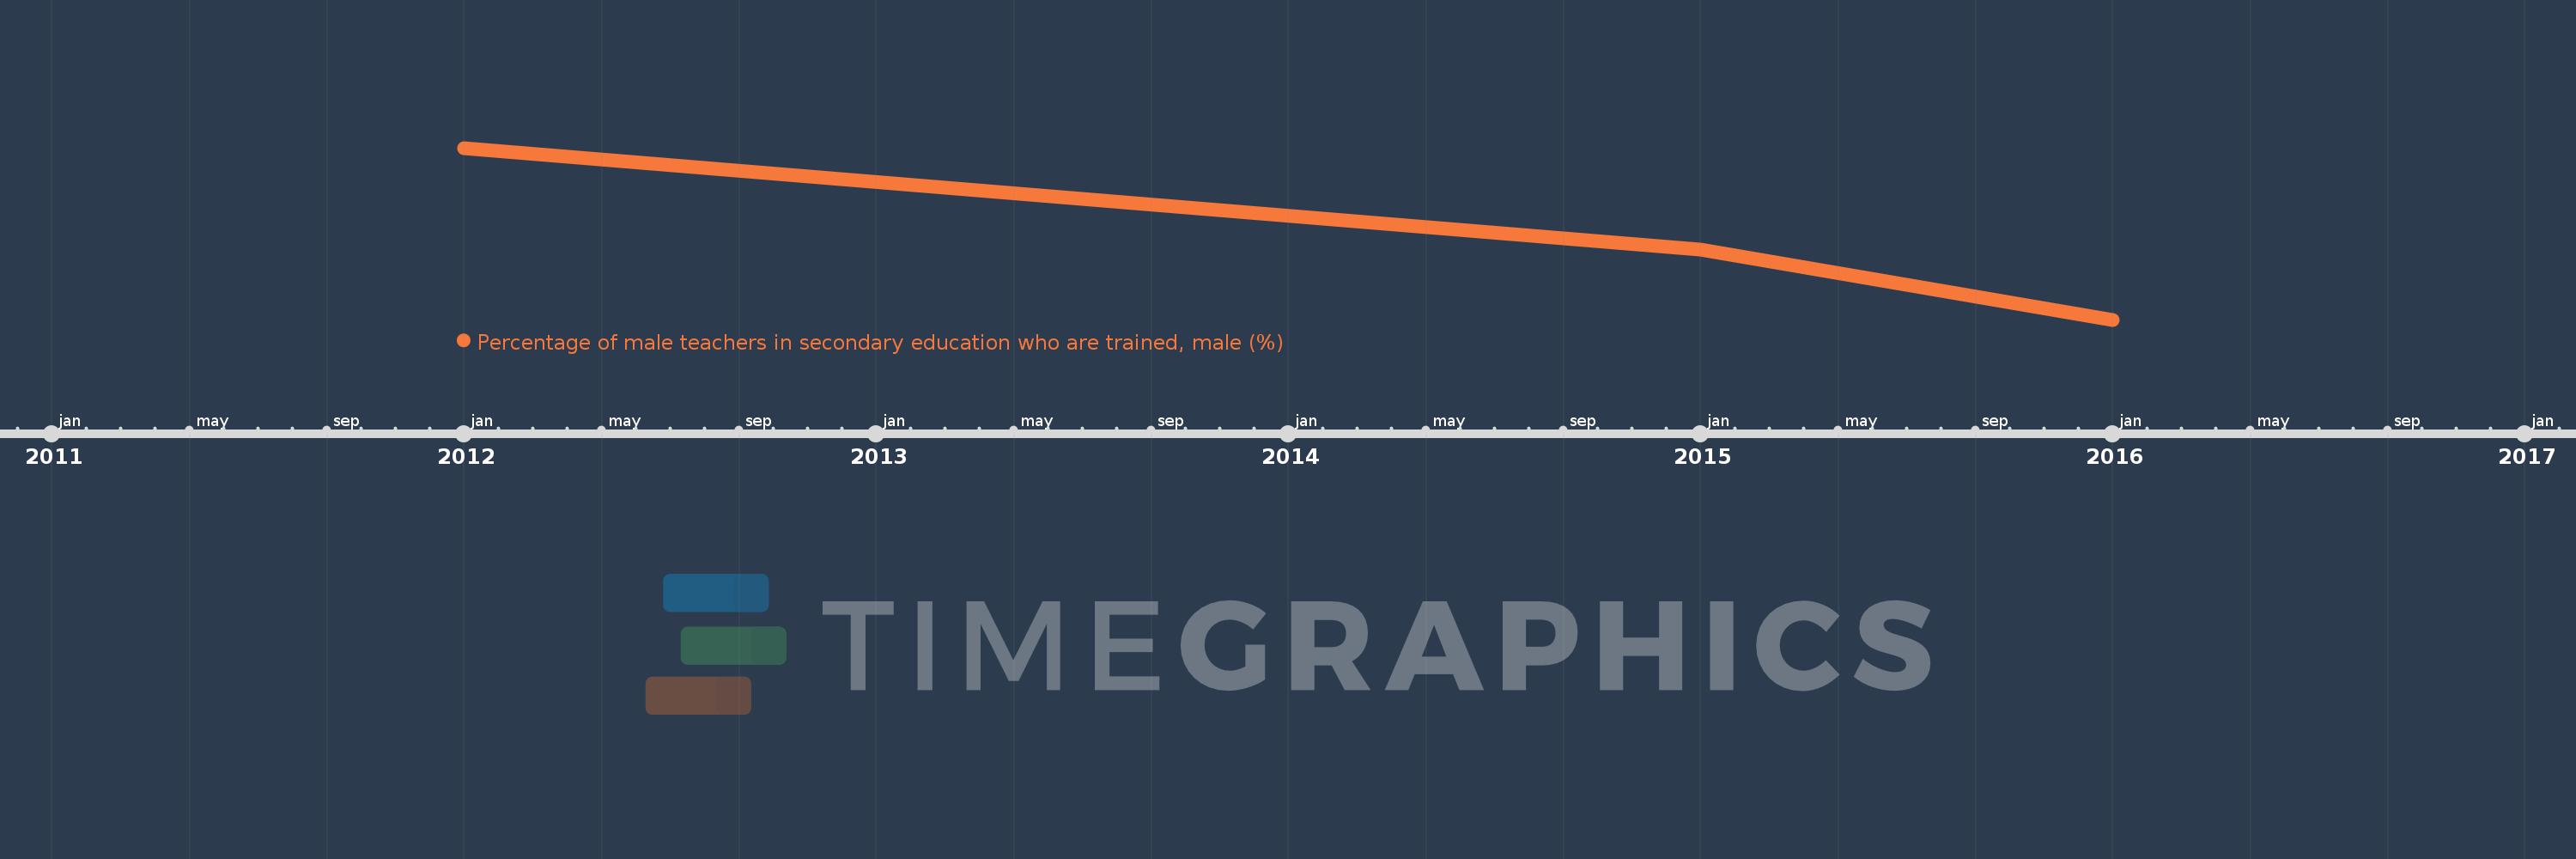
This timeline shows a graph from 2012 to 2016 of Sao Tome and Principe. No data until 2011. Number of actual observations by date: 3.
Source name:
World Development Indicators
Source organization:
UNESCO Institute for Statistics
Categories, topics:
Education
Last updated:
apr 23, 2017
Indicators value changes by year
Minimum:
25.921
jan 1, 2016
Maximum:
43.451
jan 1, 2012
At the date of observation
Value
Absolute change
Change from the previous value
jan 1, 2012
43.451
+43.451
0.0%
jan 1, 2015
33.092
-10.359
-23.84%
jan 1, 2016
25.921
-7.172
-21.67%
Ranking of countries by current statistics by years