Download This statistics in other country:
Timeline:
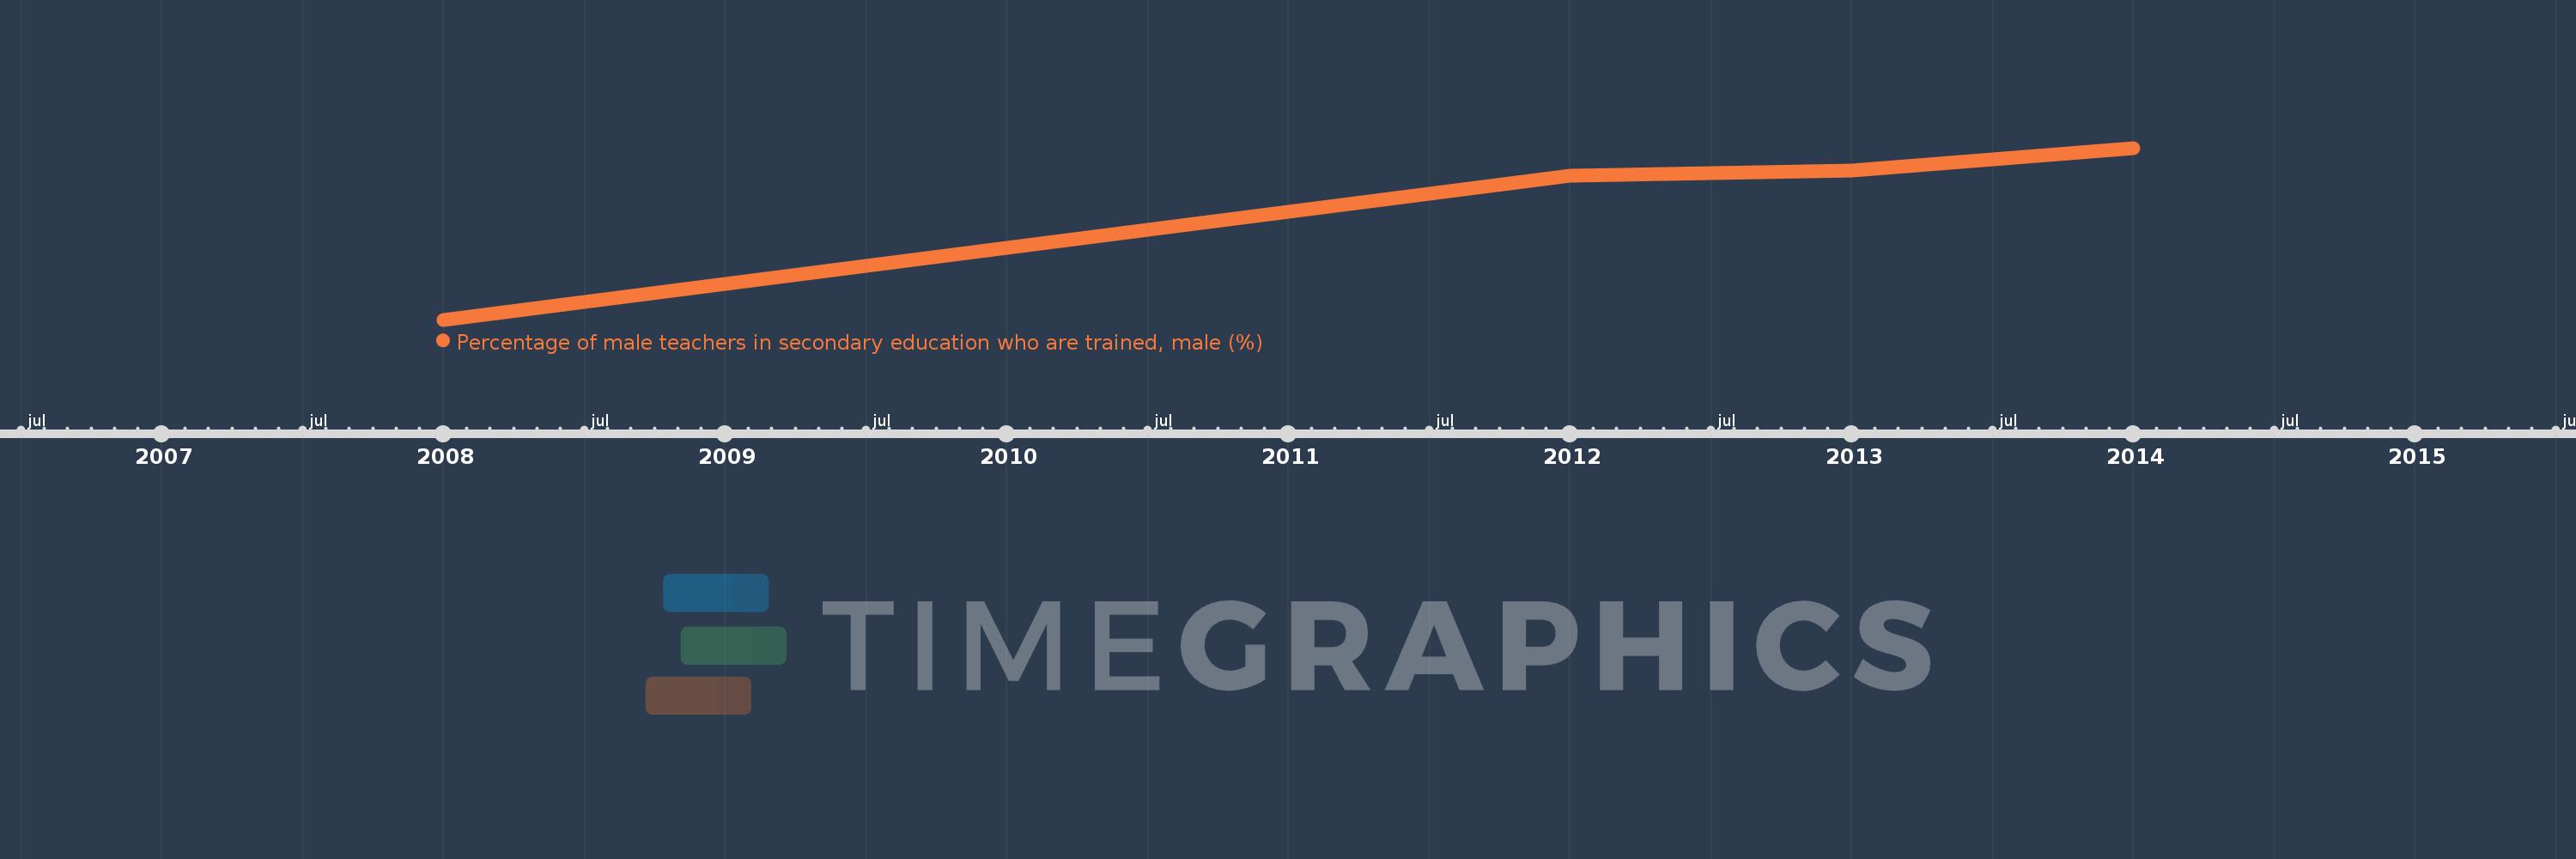
This timeline shows a graph from 2008 to 2014 of Rwanda. No data until 2007. Number of actual observations by date: 4.
Source name:
World Development Indicators
Source organization:
UNESCO Institute for Statistics
Categories, topics:
Education
Last updated:
apr 23, 2017
Indicators value changes by year
Minimum:
59.128
jan 1, 2008
Maximum:
92.603
jan 1, 2014
At the date of observation
Value
Absolute change
Change from the previous value
jan 1, 2008
59.128
+59.128
0.0%
jan 1, 2012
87.198
+28.07
47.47%
jan 1, 2013
88.273
+1.076
1.23%
jan 1, 2014
92.603
+4.329
4.9%
Ranking of countries by current statistics by years