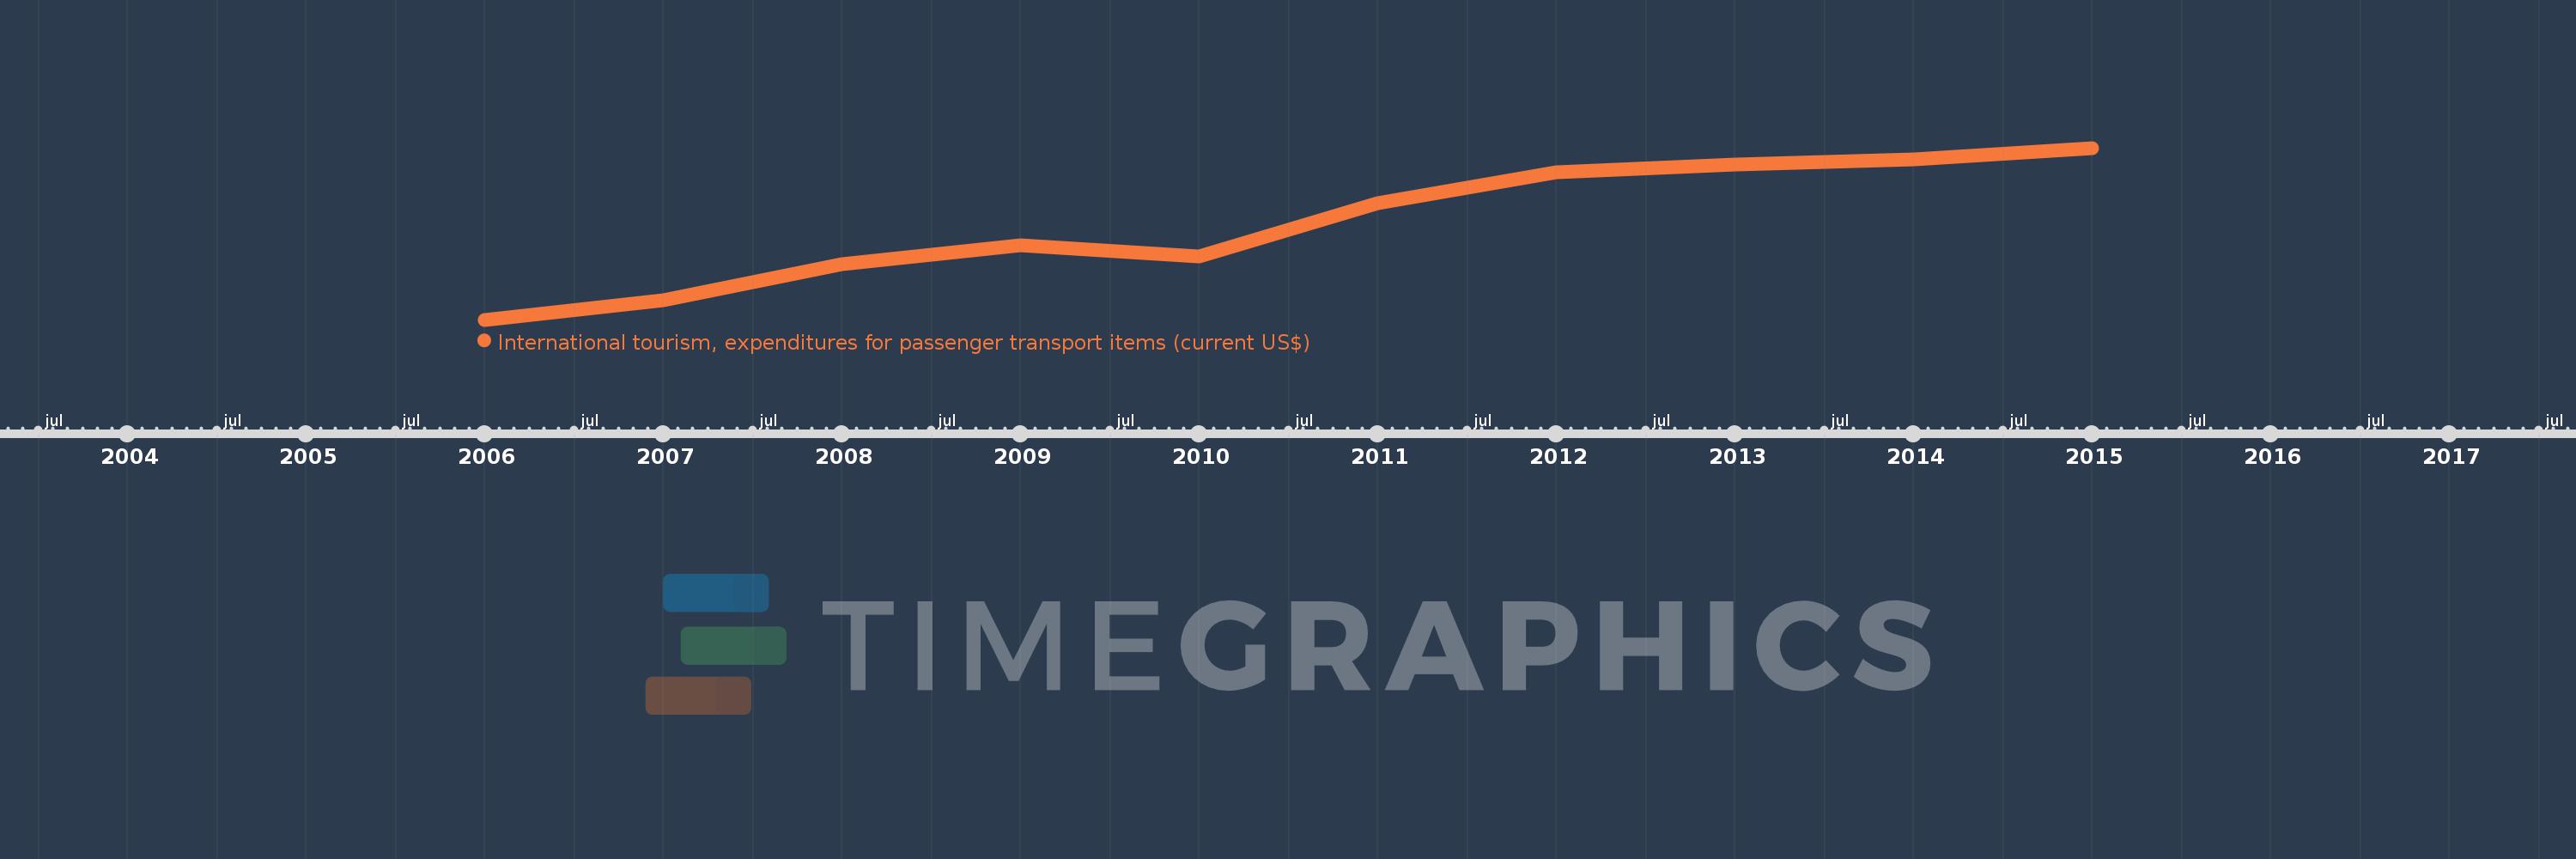
This timeline shows a graph from 2006 to 2015 of Sub-Saharan Africa (IDA & IBRD countries). No data until 2005. Number of actual observations by date: 10.
Source name:
World Development Indicators
Source organization:
World Tourism Organization, Yearbook of Tourism Statistics, Compendium of Tourism Statistics and data files.
Categories, topics:
Private Sector, Trade
Last updated:
apr 23, 2017
Indicators value changes by year
Meaning:
7.836 bln
Minimum:
3.494 bln
jan 1, 2006
Maximum:
11.232 bln
jan 1, 2015
At the date of observation
Value
Absolute change
Change from the previous value
jan 1, 2006
3.494 bln
+3.494 bln
0.0%
jan 1, 2007
4.367 bln
+872.477 mln
24.97%
jan 1, 2008
6.001 bln
+1.634 bln
37.42%
jan 1, 2009
6.837 bln
+835.402 mln
13.92%
jan 1, 2010
6.338 bln
-498.111 mln
-7.29%
jan 1, 2011
8.746 bln
+2.408 bln
37.99%
jan 1, 2012
10.142 bln
+1.396 bln
15.96%
jan 1, 2013
10.494 bln
+351.702 mln
3.47%
jan 1, 2014
10.706 bln
+212.55 mln
2.03%
jan 1, 2015
11.232 bln
+525.774 mln
4.91%
Ranking of countries by current statistics by years