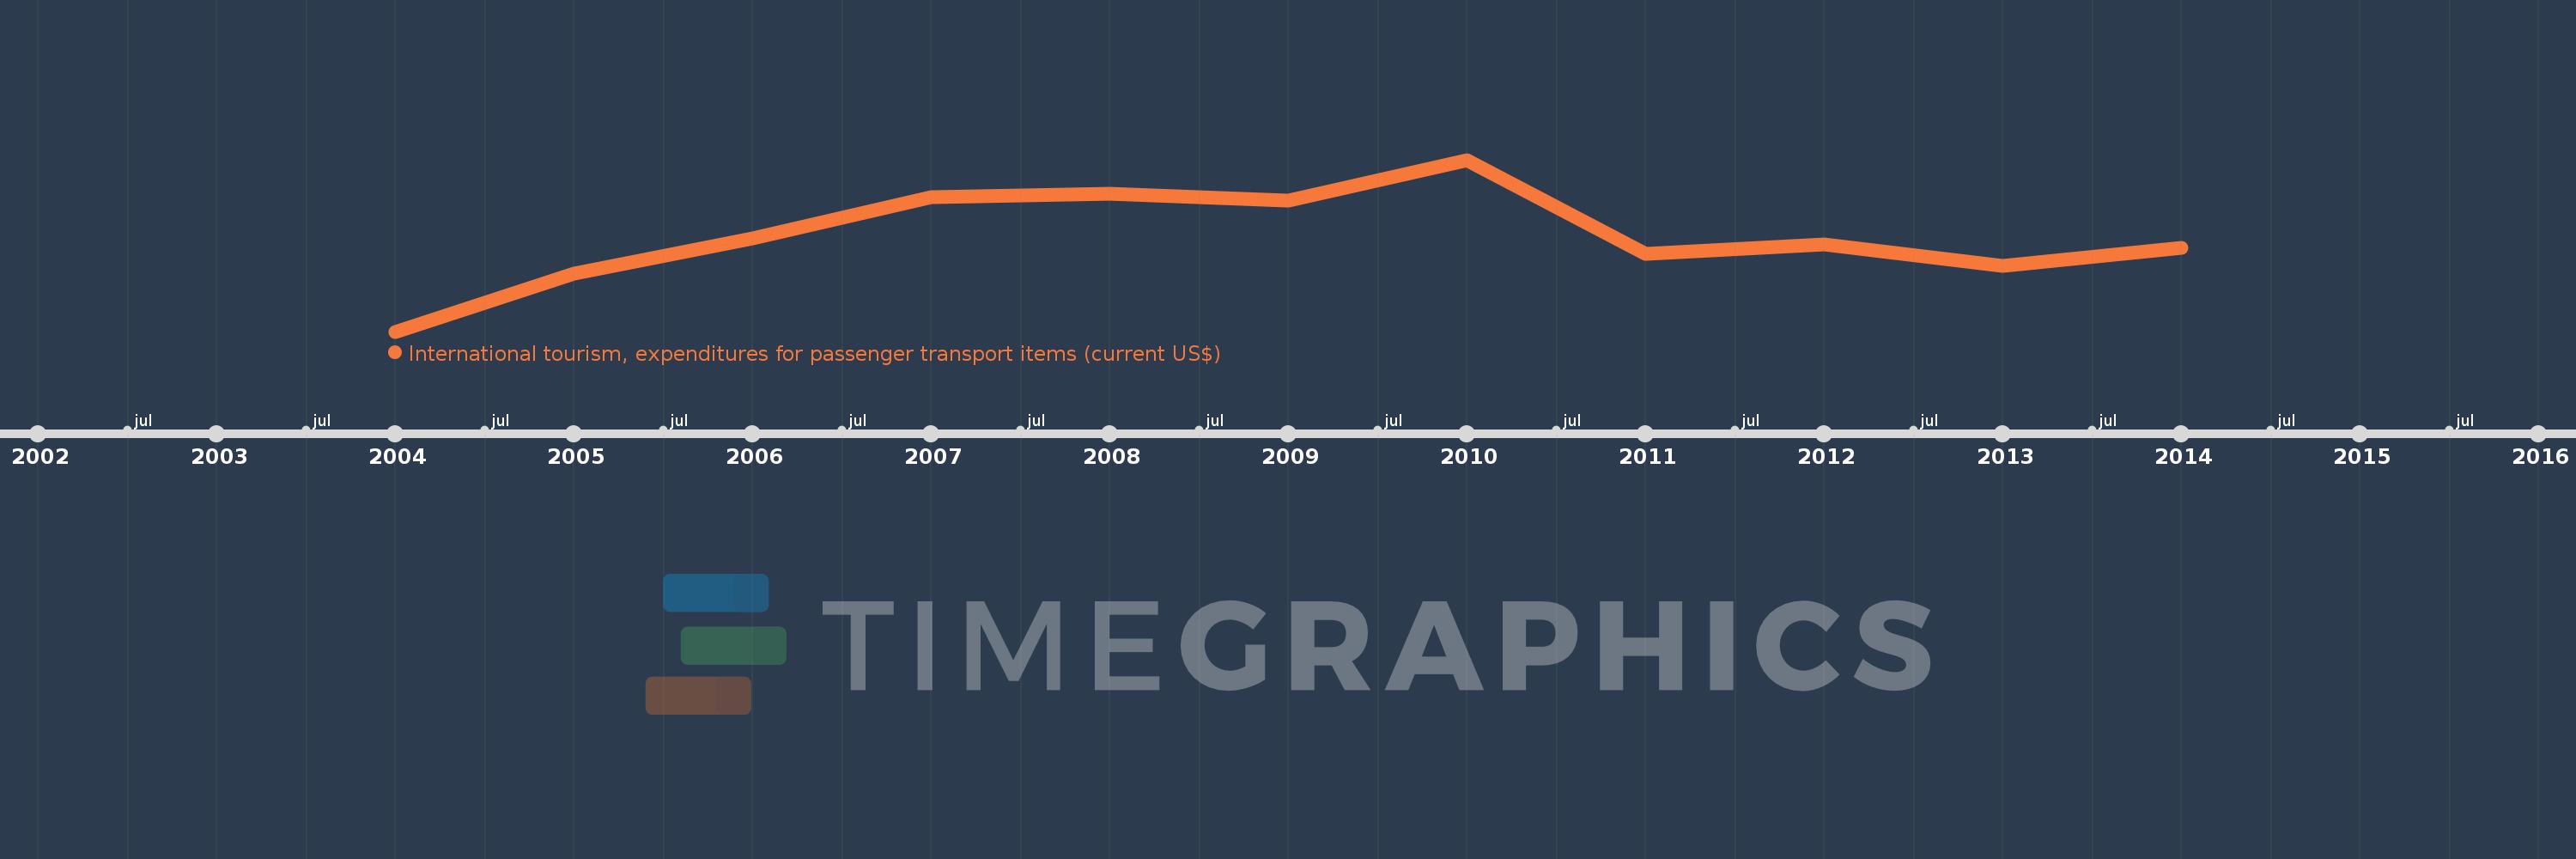
This timeline shows a graph from 2004 to 2014 of Fragile and conflict affected situations. No data until 2003. Number of actual observations by date: 11.
Source name:
World Development Indicators
Source organization:
World Tourism Organization, Yearbook of Tourism Statistics, Compendium of Tourism Statistics and data files.
Categories, topics:
Private Sector, Trade
Last updated:
apr 23, 2017
Indicators value changes by year
Meaning:
2.123 bln
Minimum:
1.511 bln
jan 1, 2004
Maximum:
2.622 bln
jan 1, 2010
At the date of observation
Value
Absolute change
Change from the previous value
jan 1, 2004
1.511 bln
+1.511 bln
0.0%
jan 1, 2005
1.888 bln
+376.986 mln
24.95%
jan 1, 2006
2.114 bln
+225.826 mln
11.96%
jan 1, 2007
2.38 bln
+265.626 mln
12.57%
jan 1, 2008
2.402 bln
+22.459 mln
0.94%
jan 1, 2009
2.356 bln
-46.245 mln
-1.93%
jan 1, 2010
2.622 bln
+266.162 mln
11.3%
jan 1, 2011
2.016 bln
-605.852 mln
-23.11%
jan 1, 2012
2.074 bln
+57.986 mln
2.88%
jan 1, 2013
1.936 bln
-137.811 mln
-6.64%
jan 1, 2014
2.053 bln
+116.877 mln
6.04%
Ranking of countries by current statistics by years