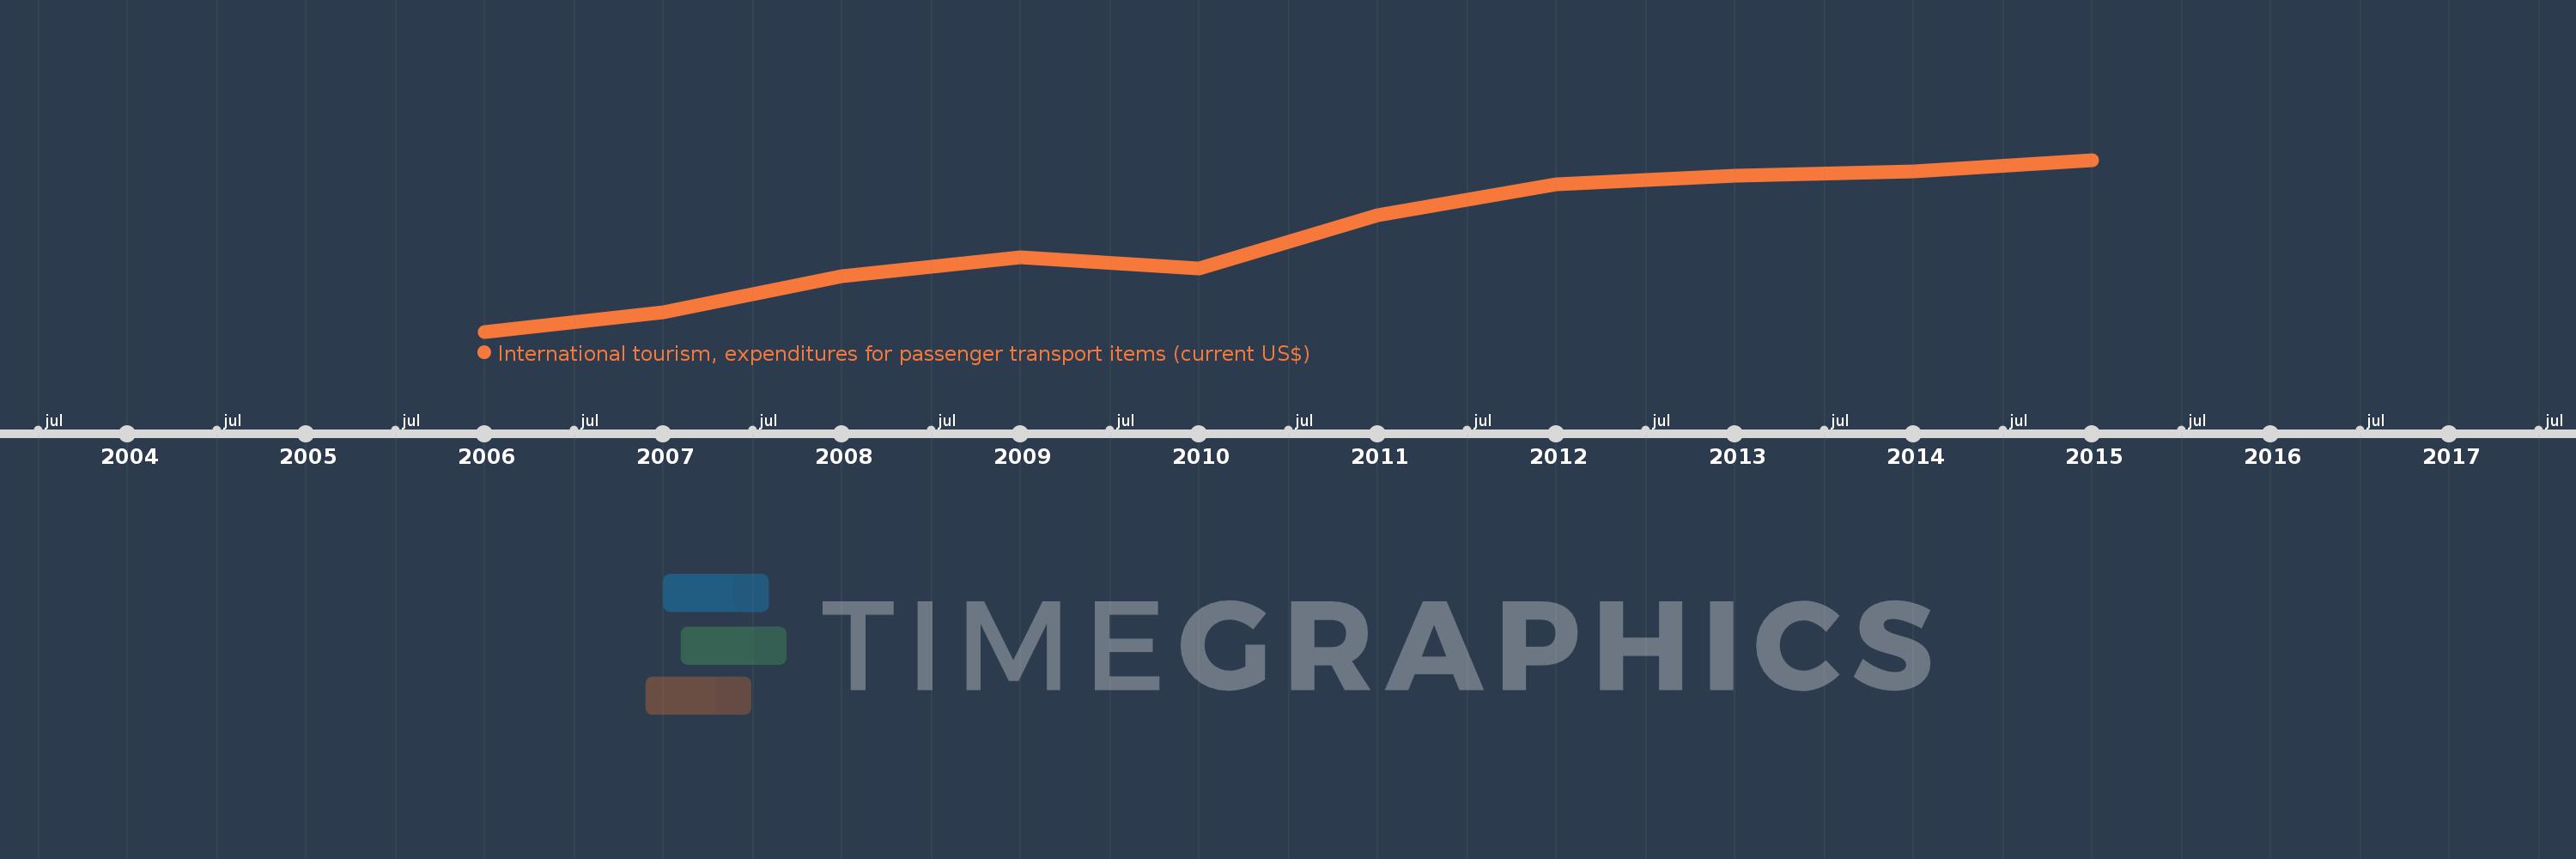
This timeline shows a graph from 2006 to 2015 of Sub-Saharan Africa (excluding high income). No data until 2005. Number of actual observations by date: 10.
Source name:
World Development Indicators
Source organization:
World Tourism Organization, Yearbook of Tourism Statistics, Compendium of Tourism Statistics and data files.
Categories, topics:
Private Sector, Trade
Last updated:
apr 23, 2017
Indicators value changes by year
Meaning:
7.812 bln
Minimum:
3.472 bln
jan 1, 2006
Maximum:
11.206 bln
jan 1, 2015
At the date of observation
Value
Absolute change
Change from the previous value
jan 1, 2006
3.472 bln
+3.472 bln
0.0%
jan 1, 2007
4.345 bln
+873.1 mln
25.14%
jan 1, 2008
5.969 bln
+1.623 bln
37.35%
jan 1, 2009
6.811 bln
+842.143 mln
14.11%
jan 1, 2010
6.317 bln
-493.554 mln
-7.25%
jan 1, 2011
8.722 bln
+2.405 bln
38.07%
jan 1, 2012
10.119 bln
+1.397 bln
16.02%
jan 1, 2013
10.474 bln
+354.613 mln
3.5%
jan 1, 2014
10.684 bln
+210.154 mln
2.01%
jan 1, 2015
11.206 bln
+522.187 mln
4.89%
Ranking of countries by current statistics by years