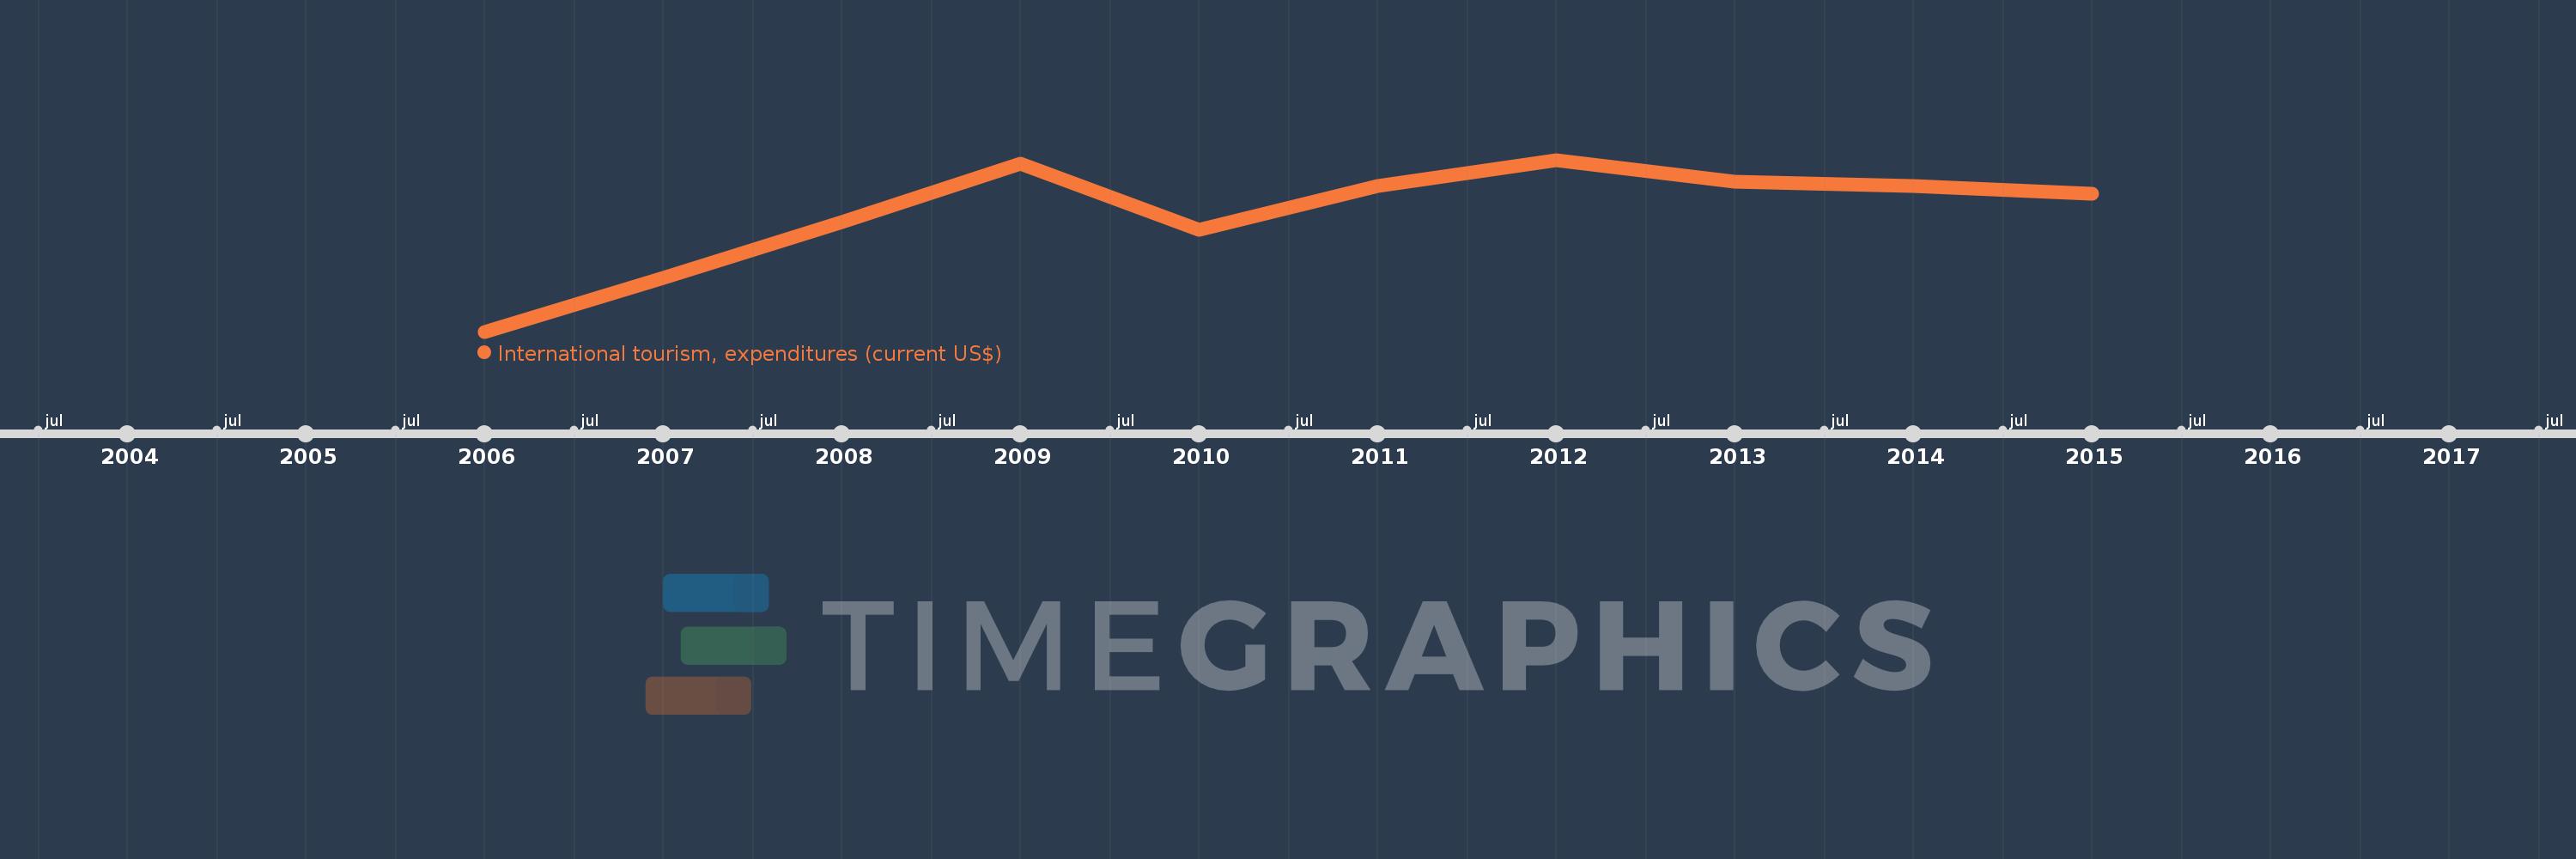
This timeline shows a graph from 2006 to 2015 of Sub-Saharan Africa (IDA & IBRD countries). No data until 2005. Number of actual observations by date: 10.
Source name:
World Development Indicators
Source organization:
World Tourism Organization, Yearbook of Tourism Statistics, Compendium of Tourism Statistics and data files.
Categories, topics:
Private Sector, Trade
Last updated:
apr 23, 2017
Indicators value changes by year
Meaning:
23.834 bln
Minimum:
12.048 bln
jan 1, 2006
Maximum:
29.137 bln
jan 1, 2012
At the date of observation
Value
Absolute change
Change from the previous value
jan 1, 2006
12.048 bln
+12.048 bln
0.0%
jan 1, 2007
17.426 bln
+5.378 bln
44.64%
jan 1, 2008
22.922 bln
+5.495 bln
31.53%
jan 1, 2009
28.786 bln
+5.864 bln
25.58%
jan 1, 2010
22.204 bln
-6.582 bln
-22.87%
jan 1, 2011
26.566 bln
+4.363 bln
19.65%
jan 1, 2012
29.137 bln
+2.57 bln
9.67%
jan 1, 2013
26.949 bln
-2.188 bln
-7.51%
jan 1, 2014
26.572 bln
-376.902 mln
-1.4%
jan 1, 2015
25.729 bln
-843.108 mln
-3.17%
Ranking of countries by current statistics by years