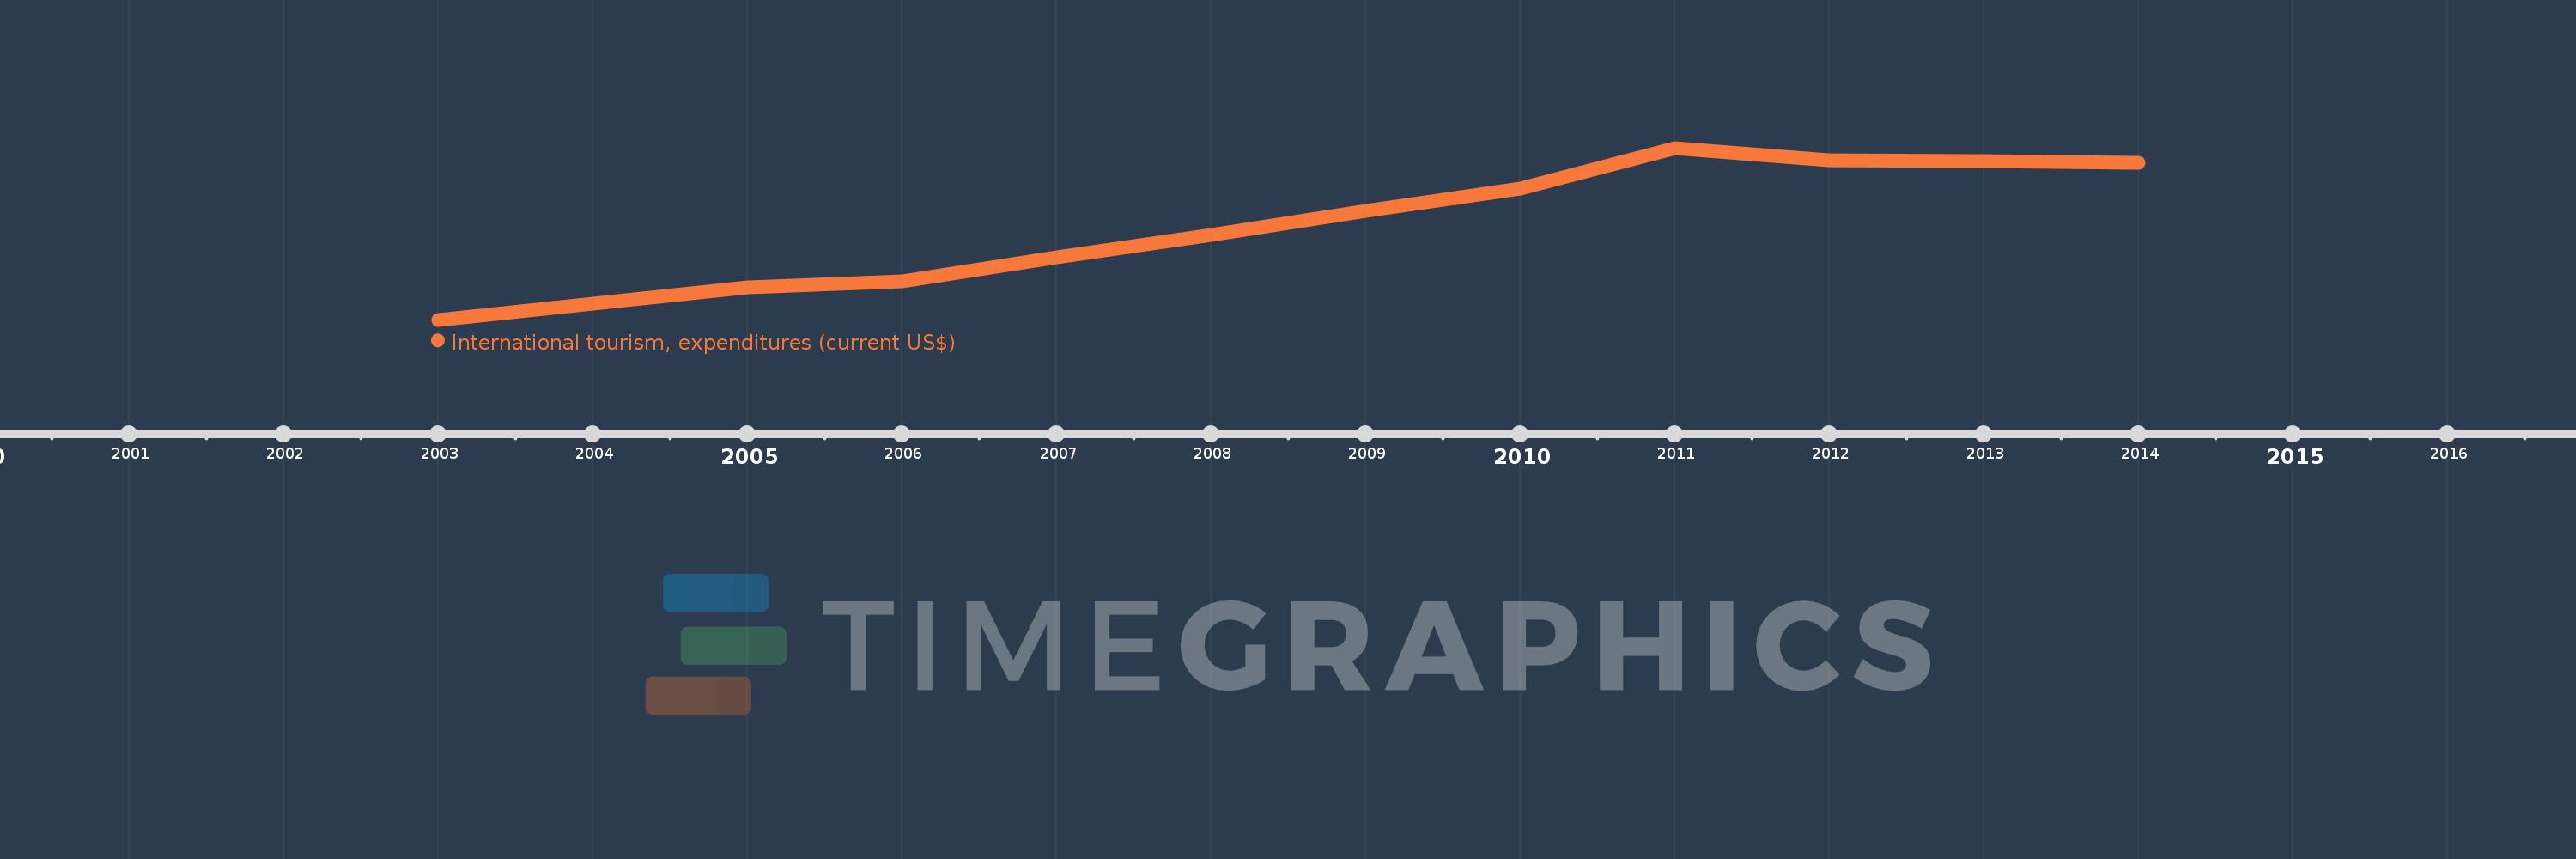
This timeline shows a graph from 2003 to 2014 of Fragile and conflict affected situations. No data until 2002. Number of actual observations by date: 12.
Source name:
World Development Indicators
Source organization:
World Tourism Organization, Yearbook of Tourism Statistics, Compendium of Tourism Statistics and data files.
Categories, topics:
Private Sector, Trade
Last updated:
apr 23, 2017
Indicators value changes by year
Meaning:
11.851 bln
Minimum:
7.06 bln
jan 1, 2003
Maximum:
15.866 bln
jan 1, 2011
At the date of observation
Value
Absolute change
Change from the previous value
jan 1, 2003
7.06 bln
+7.06 bln
0.0%
jan 1, 2004
7.879 bln
+819.364 mln
11.61%
jan 1, 2005
8.735 bln
+856.015 mln
10.86%
jan 1, 2006
9.018 bln
+282.373 mln
3.23%
jan 1, 2007
10.249 bln
+1.232 bln
13.66%
jan 1, 2008
11.394 bln
+1.144 bln
11.16%
jan 1, 2009
12.648 bln
+1.254 bln
11.01%
jan 1, 2010
13.8 bln
+1.152 bln
9.11%
jan 1, 2011
15.866 bln
+2.065 bln
14.97%
jan 1, 2012
15.248 bln
-617.994 mln
-3.9%
jan 1, 2013
15.19 bln
-57.828 mln
-0.38%
jan 1, 2014
15.126 bln
-64.371 mln
-0.42%
Ranking of countries by current statistics by years