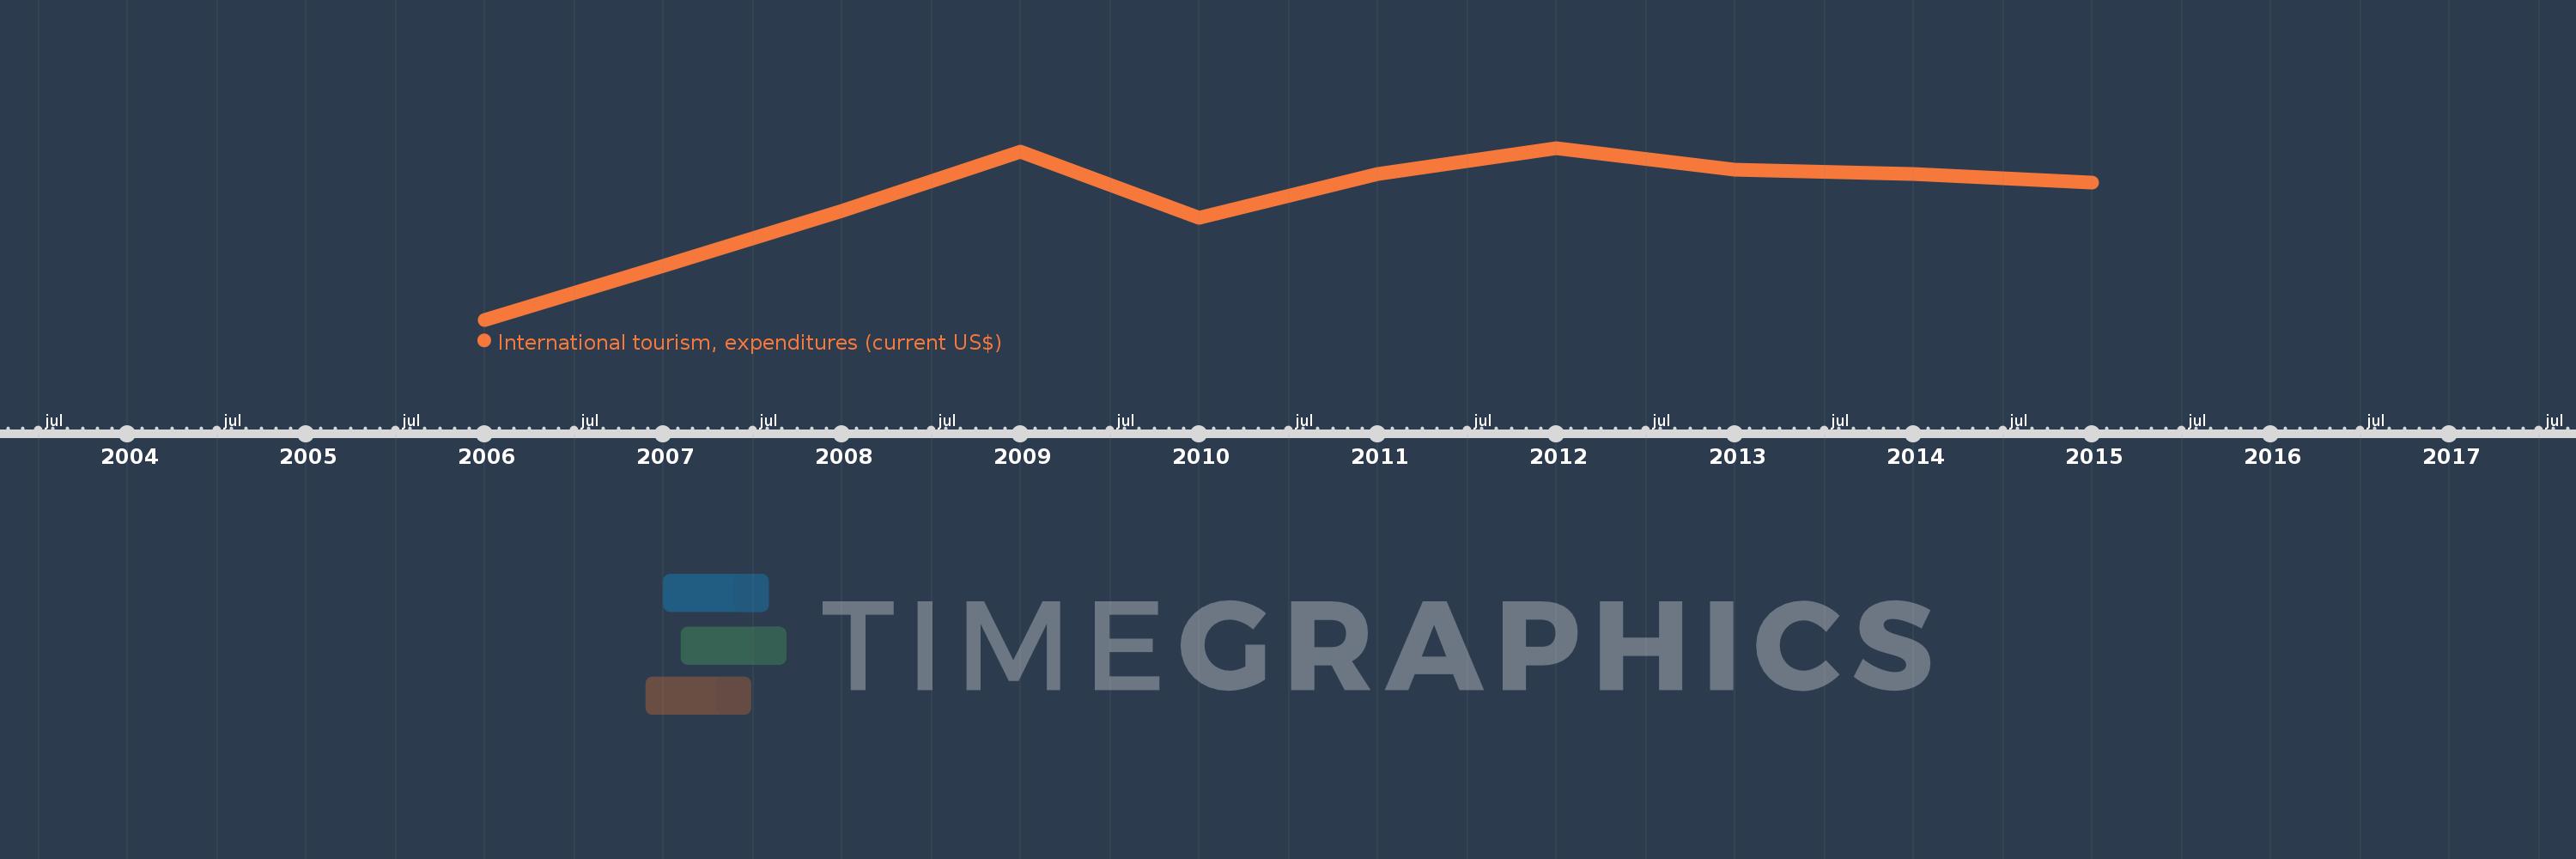
This timeline shows a graph from 2006 to 2015 of Sub-Saharan Africa (excluding high income). No data until 2005. Number of actual observations by date: 10.
Source name:
World Development Indicators
Source organization:
World Tourism Organization, Yearbook of Tourism Statistics, Compendium of Tourism Statistics and data files.
Categories, topics:
Private Sector, Trade
Last updated:
apr 23, 2017
Indicators value changes by year
Meaning:
23.773 bln
Minimum:
11.988 bln
jan 1, 2006
Maximum:
29.073 bln
jan 1, 2012
At the date of observation
Value
Absolute change
Change from the previous value
jan 1, 2006
11.988 bln
+11.988 bln
0.0%
jan 1, 2007
17.37 bln
+5.383 bln
44.9%
jan 1, 2008
22.848 bln
+5.478 bln
31.54%
jan 1, 2009
28.724 bln
+5.875 bln
25.72%
jan 1, 2010
22.149 bln
-6.575 bln
-22.89%
jan 1, 2011
26.505 bln
+4.356 bln
19.67%
jan 1, 2012
29.073 bln
+2.569 bln
9.69%
jan 1, 2013
26.893 bln
-2.181 bln
-7.5%
jan 1, 2014
26.511 bln
-381.328 mln
-1.42%
jan 1, 2015
25.664 bln
-847.254 mln
-3.2%
Ranking of countries by current statistics by years