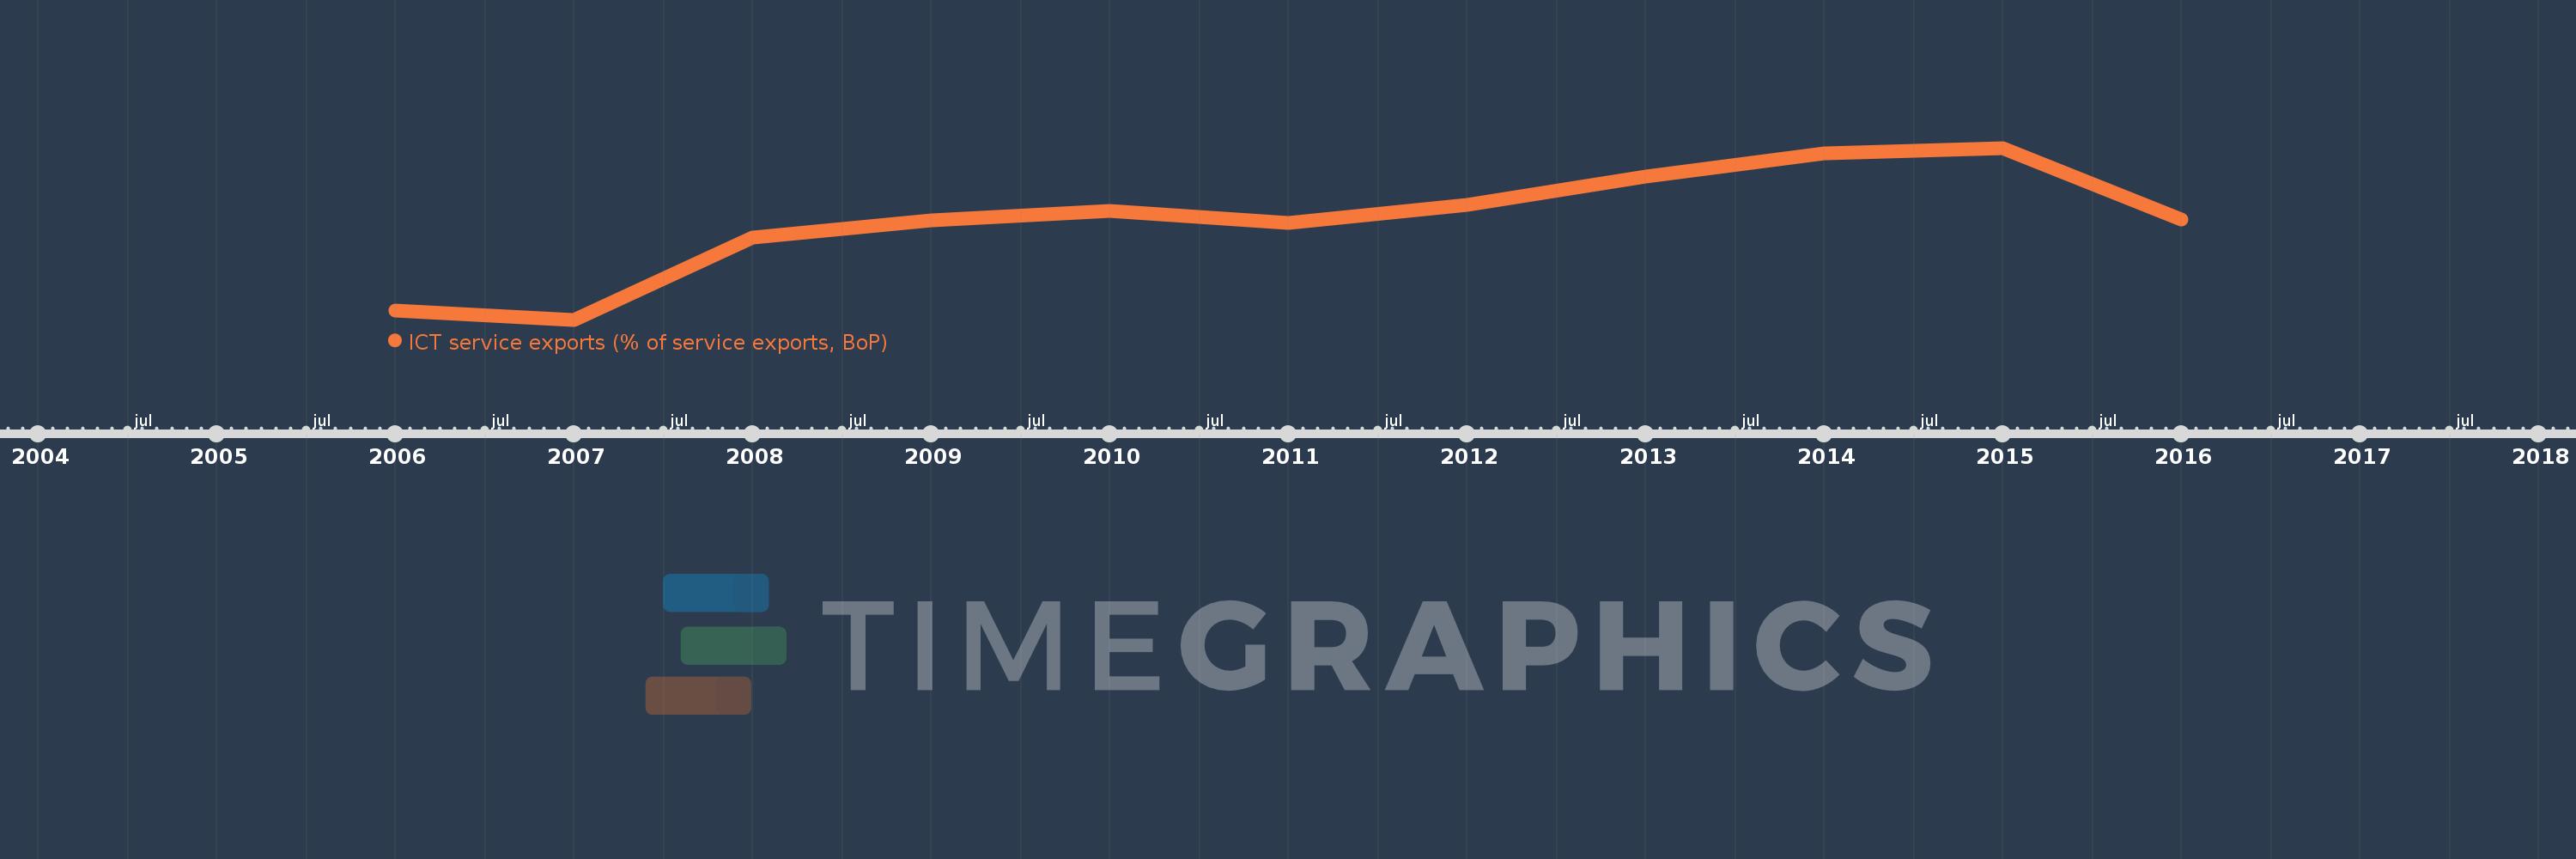
This timeline shows a graph from 2006 to 2016 of Sub-Saharan Africa (IDA & IBRD countries). No data until 2005. Number of actual observations by date: 11.
Source name:
World Development Indicators
Source organization:
International Monetary Fund, Balance of Payments Statistics Yearbook and data files.
Categories, topics:
Economy & Growth, Infrastructure, Trade
Last updated:
apr 23, 2017
Indicators value changes by year
Meaning:
15.816
Minimum:
12.035
jan 1, 2007
Maximum:
18.573
jan 1, 2015
At the date of observation
Value
Absolute change
Change from the previous value
jan 1, 2006
12.372
+12.372
0.0%
jan 1, 2007
12.035
-0.337
-2.73%
jan 1, 2008
15.163
+3.128
25.99%
jan 1, 2009
15.829
+0.666
4.39%
jan 1, 2010
16.172
+0.343
2.17%
jan 1, 2011
15.714
-0.458
-2.83%
jan 1, 2012
16.419
+0.705
4.49%
jan 1, 2013
17.48
+1.06
6.46%
jan 1, 2014
18.382
+0.902
5.16%
jan 1, 2015
18.573
+0.191
1.04%
jan 1, 2016
15.835
-2.738
-14.74%
Ranking of countries by current statistics by years