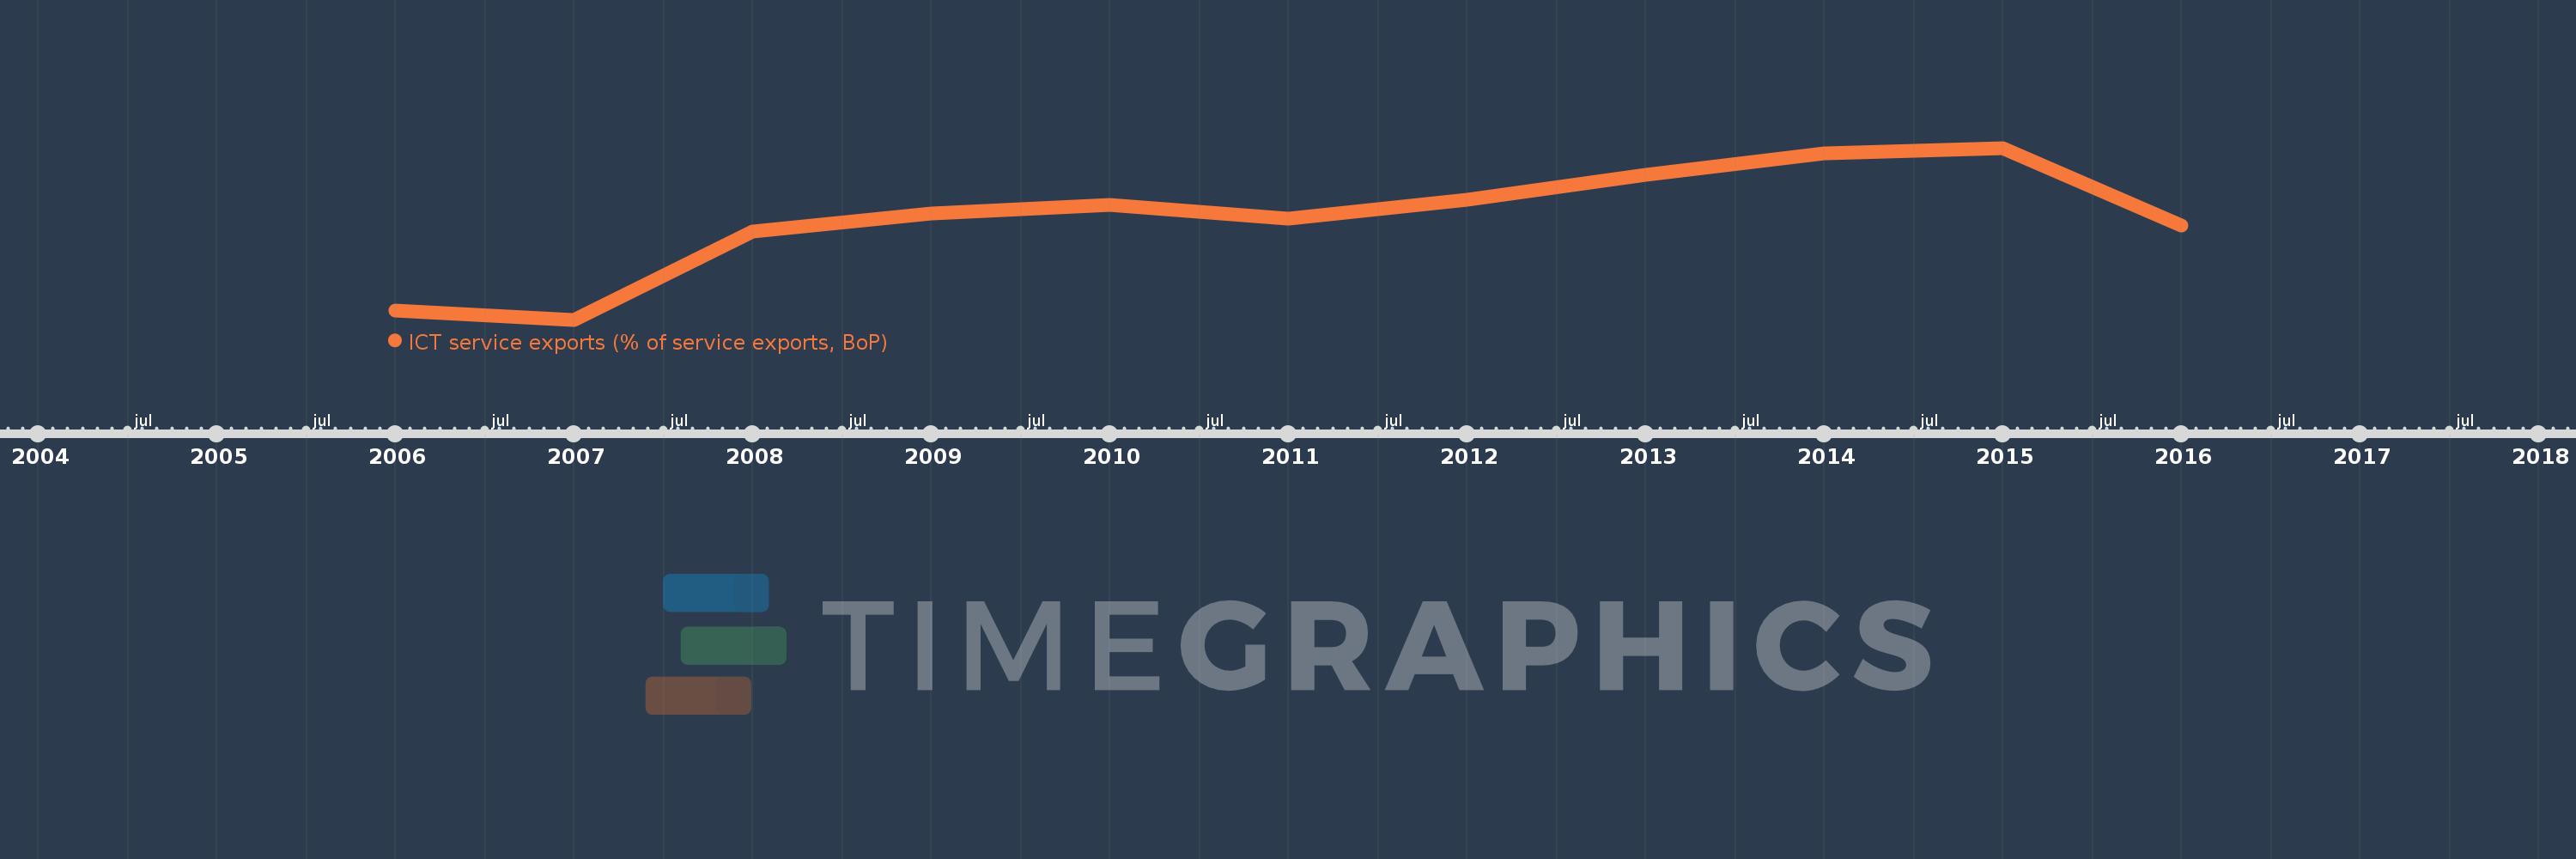
This timeline shows a graph from 2006 to 2016 of Sub-Saharan Africa (excluding high income). No data until 2005. Number of actual observations by date: 11.
Source name:
World Development Indicators
Source organization:
International Monetary Fund, Balance of Payments Statistics Yearbook and data files.
Categories, topics:
Economy & Growth, Infrastructure, Trade
Last updated:
apr 23, 2017
Indicators value changes by year
Meaning:
15.83
Minimum:
12.143
jan 1, 2007
Maximum:
18.378
jan 1, 2015
At the date of observation
Value
Absolute change
Change from the previous value
jan 1, 2006
12.48
+12.48
0.0%
jan 1, 2007
12.143
-0.338
-2.7%
jan 1, 2008
15.336
+3.193
26.3%
jan 1, 2009
16.004
+0.669
4.36%
jan 1, 2010
16.32
+0.316
1.97%
jan 1, 2011
15.808
-0.512
-3.14%
jan 1, 2012
16.506
+0.698
4.42%
jan 1, 2013
17.415
+0.909
5.51%
jan 1, 2014
18.191
+0.776
4.46%
jan 1, 2015
18.378
+0.187
1.03%
jan 1, 2016
15.55
-2.828
-15.39%
Ranking of countries by current statistics by years