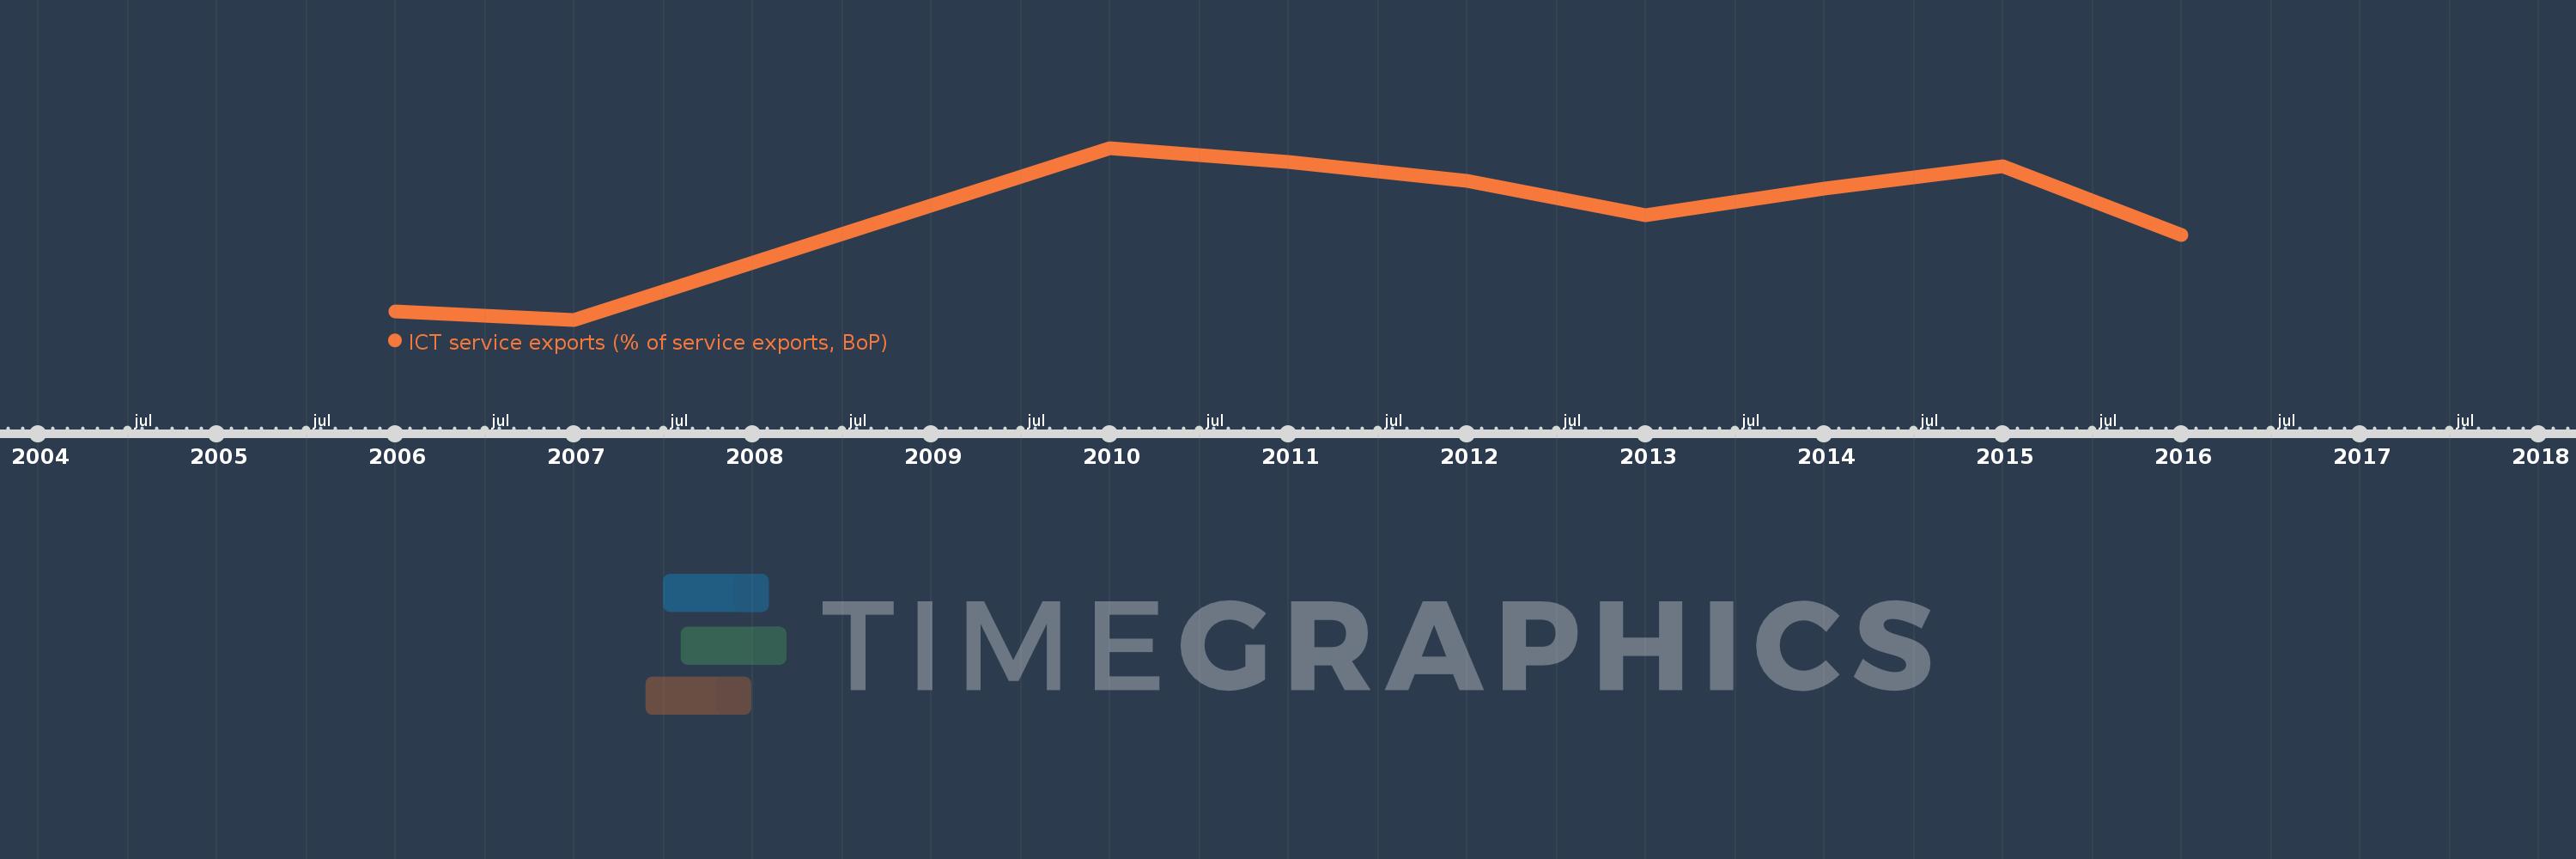
This timeline shows a graph from 2006 to 2016 of Least developed countries: UN classification. No data until 2005. Number of actual observations by date: 9.
Source name:
World Development Indicators
Source organization:
International Monetary Fund, Balance of Payments Statistics Yearbook and data files.
Categories, topics:
Economy & Growth, Infrastructure, Trade
Last updated:
apr 23, 2017
Indicators value changes by year
Meaning:
17.478
Minimum:
14.476
jan 1, 2007
Maximum:
19.356
jan 1, 2010
At the date of observation
Value
Absolute change
Change from the previous value
jan 1, 2006
14.722
+14.722
0.0%
jan 1, 2007
14.476
-0.247
-1.67%
jan 1, 2010
19.356
+4.88
33.71%
jan 1, 2011
18.957
-0.399
-2.06%
jan 1, 2012
18.426
-0.531
-2.8%
jan 1, 2013
17.455
-0.971
-5.27%
jan 1, 2014
18.208
+0.753
4.31%
jan 1, 2015
18.825
+0.618
3.39%
jan 1, 2016
16.874
-1.952
-10.37%
Ranking of countries by current statistics by years