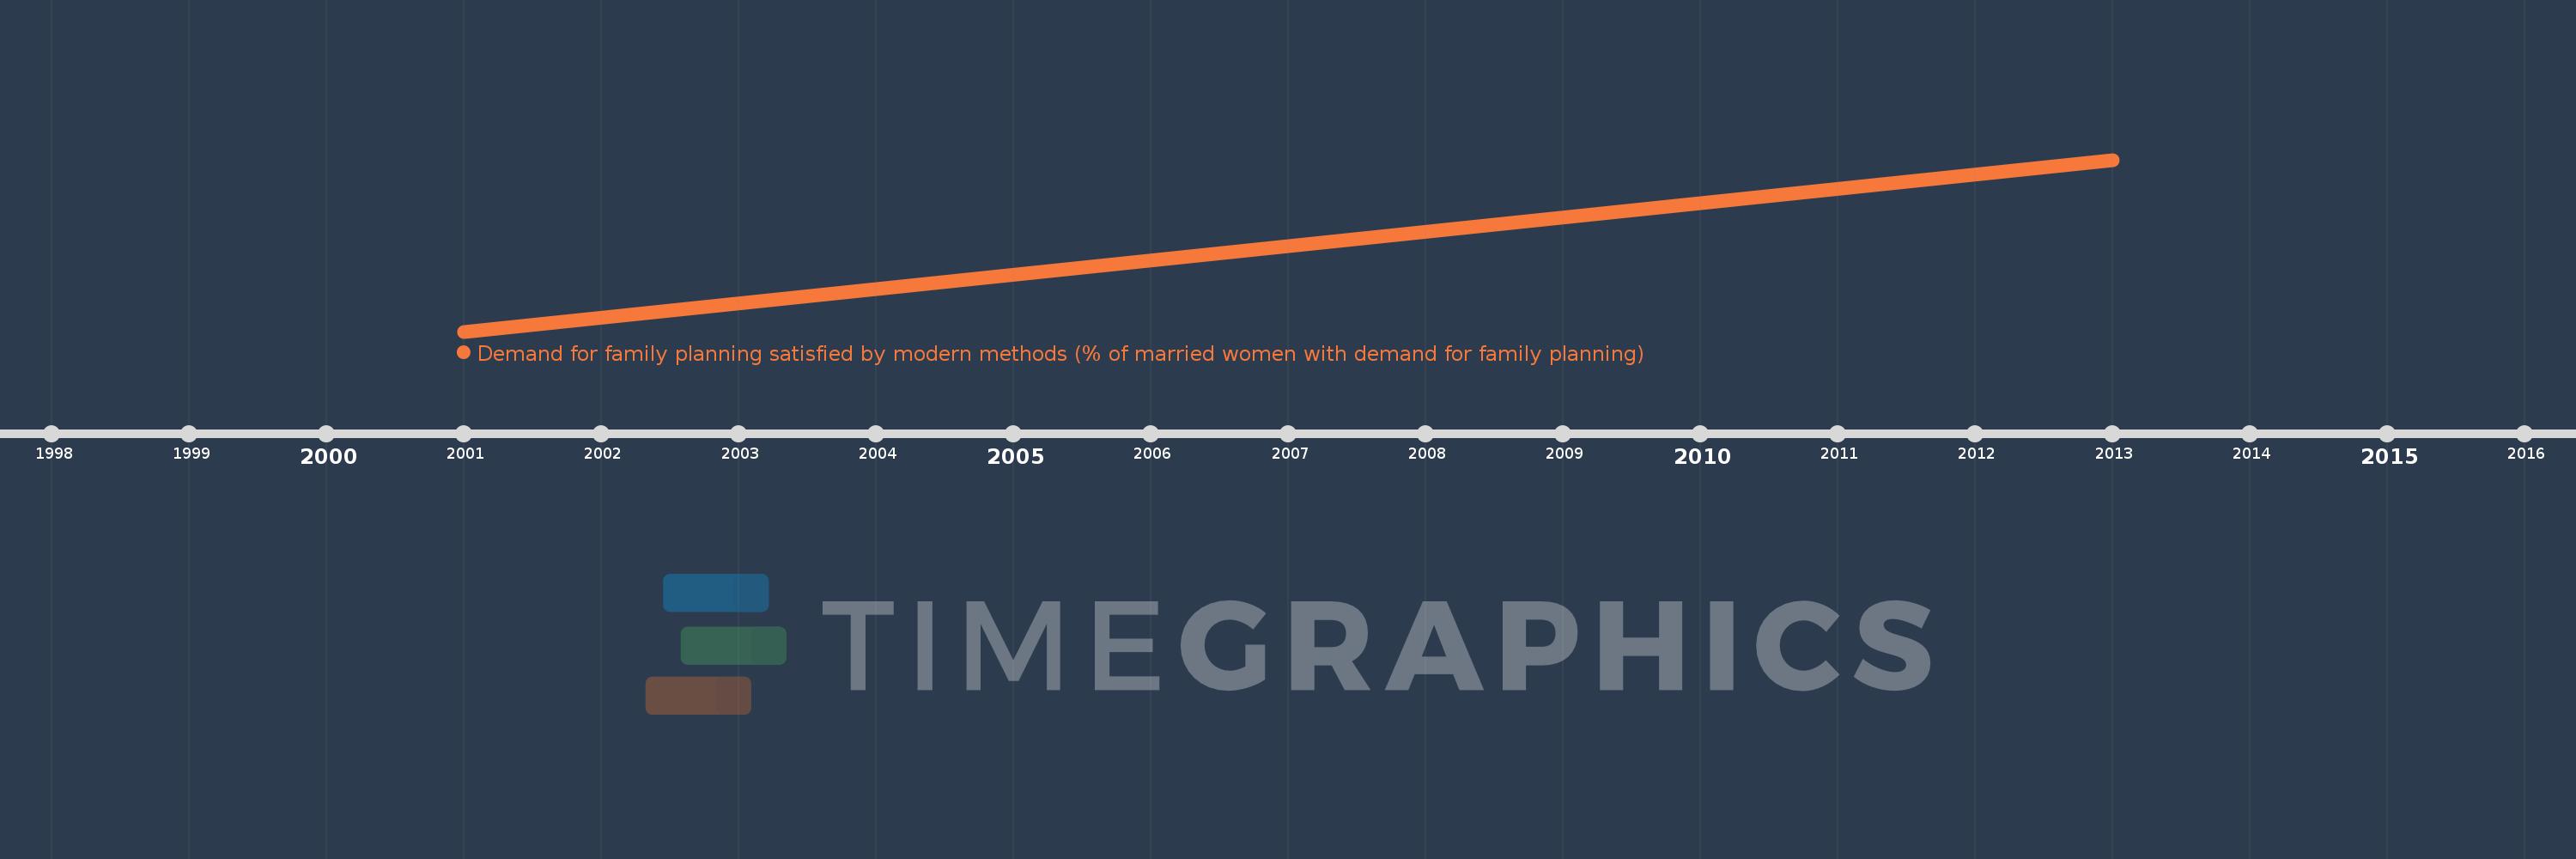
This timeline shows a graph from 2001 to 2013 of Sub-Saharan Africa (IDA & IBRD countries). No data until 2000. Number of actual observations by date: 2.
Source name:
World Development Indicators
Source organization:
Demographic and Health Surveys (DHS).
Categories, topics:
Health
Last updated:
apr 23, 2017
Indicators value changes by year
Meaning:
40.867
Minimum:
36.134
jan 1, 2001
Maximum:
45.599
jan 1, 2013
At the date of observation
Value
Absolute change
Change from the previous value
jan 1, 2001
36.134
+36.134
0.0%
jan 1, 2013
45.599
+9.465
26.19%
Ranking of countries by current statistics by years