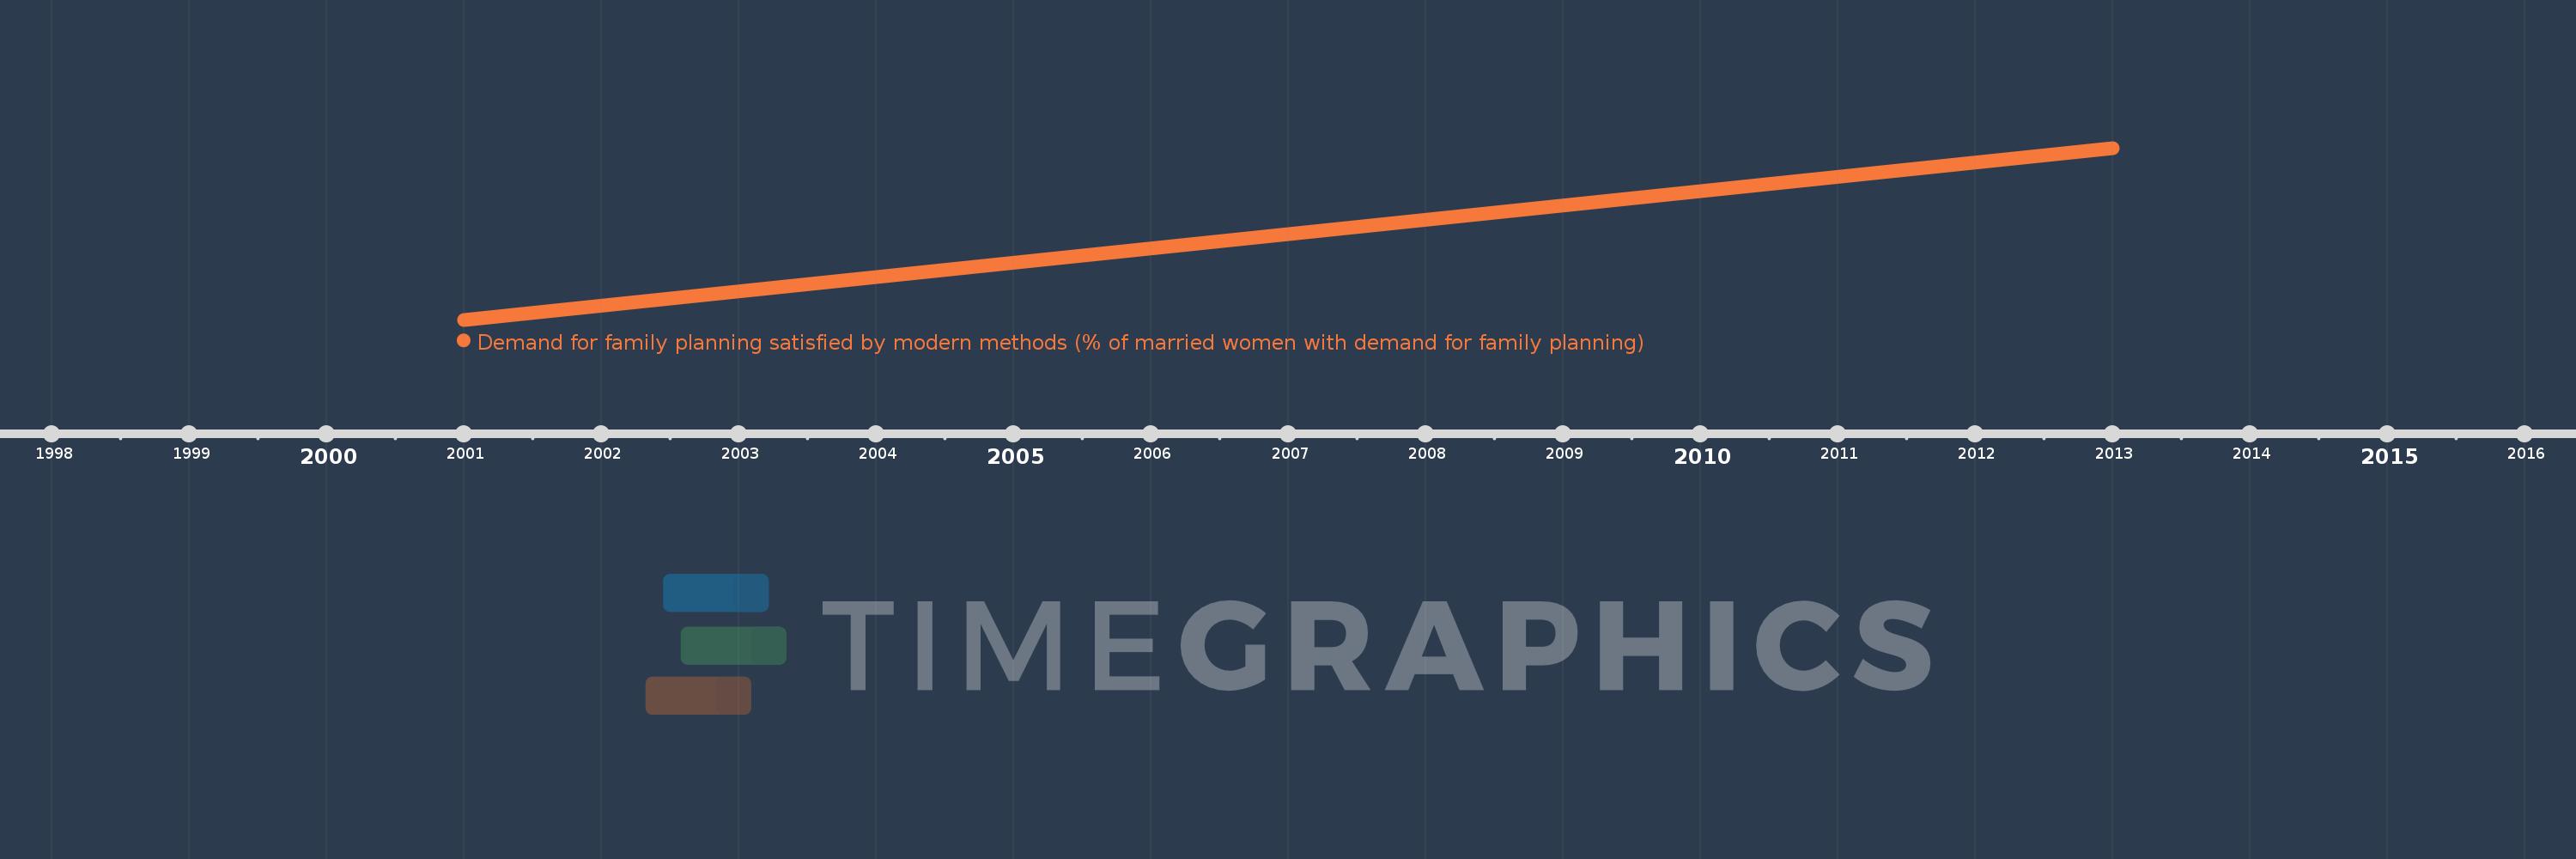
This timeline shows a graph from 2001 to 2013 of Least developed countries: UN classification. No data until 2000. Number of actual observations by date: 2.
Source name:
World Development Indicators
Source organization:
Demographic and Health Surveys (DHS).
Categories, topics:
Health
Last updated:
apr 23, 2017
Indicators value changes by year
Meaning:
48.803
Minimum:
44.663
jan 1, 2001
Maximum:
52.943
jan 1, 2013
At the date of observation
Value
Absolute change
Change from the previous value
jan 1, 2001
44.663
+44.663
0.0%
jan 1, 2013
52.943
+8.28
18.54%
Ranking of countries by current statistics by years