33
/
AIzaSyB4mHJ5NPEv-XzF7P6NDYXjlkCWaeKw5bc
November 30, 2025
222010
Peru
PER
true
2
1
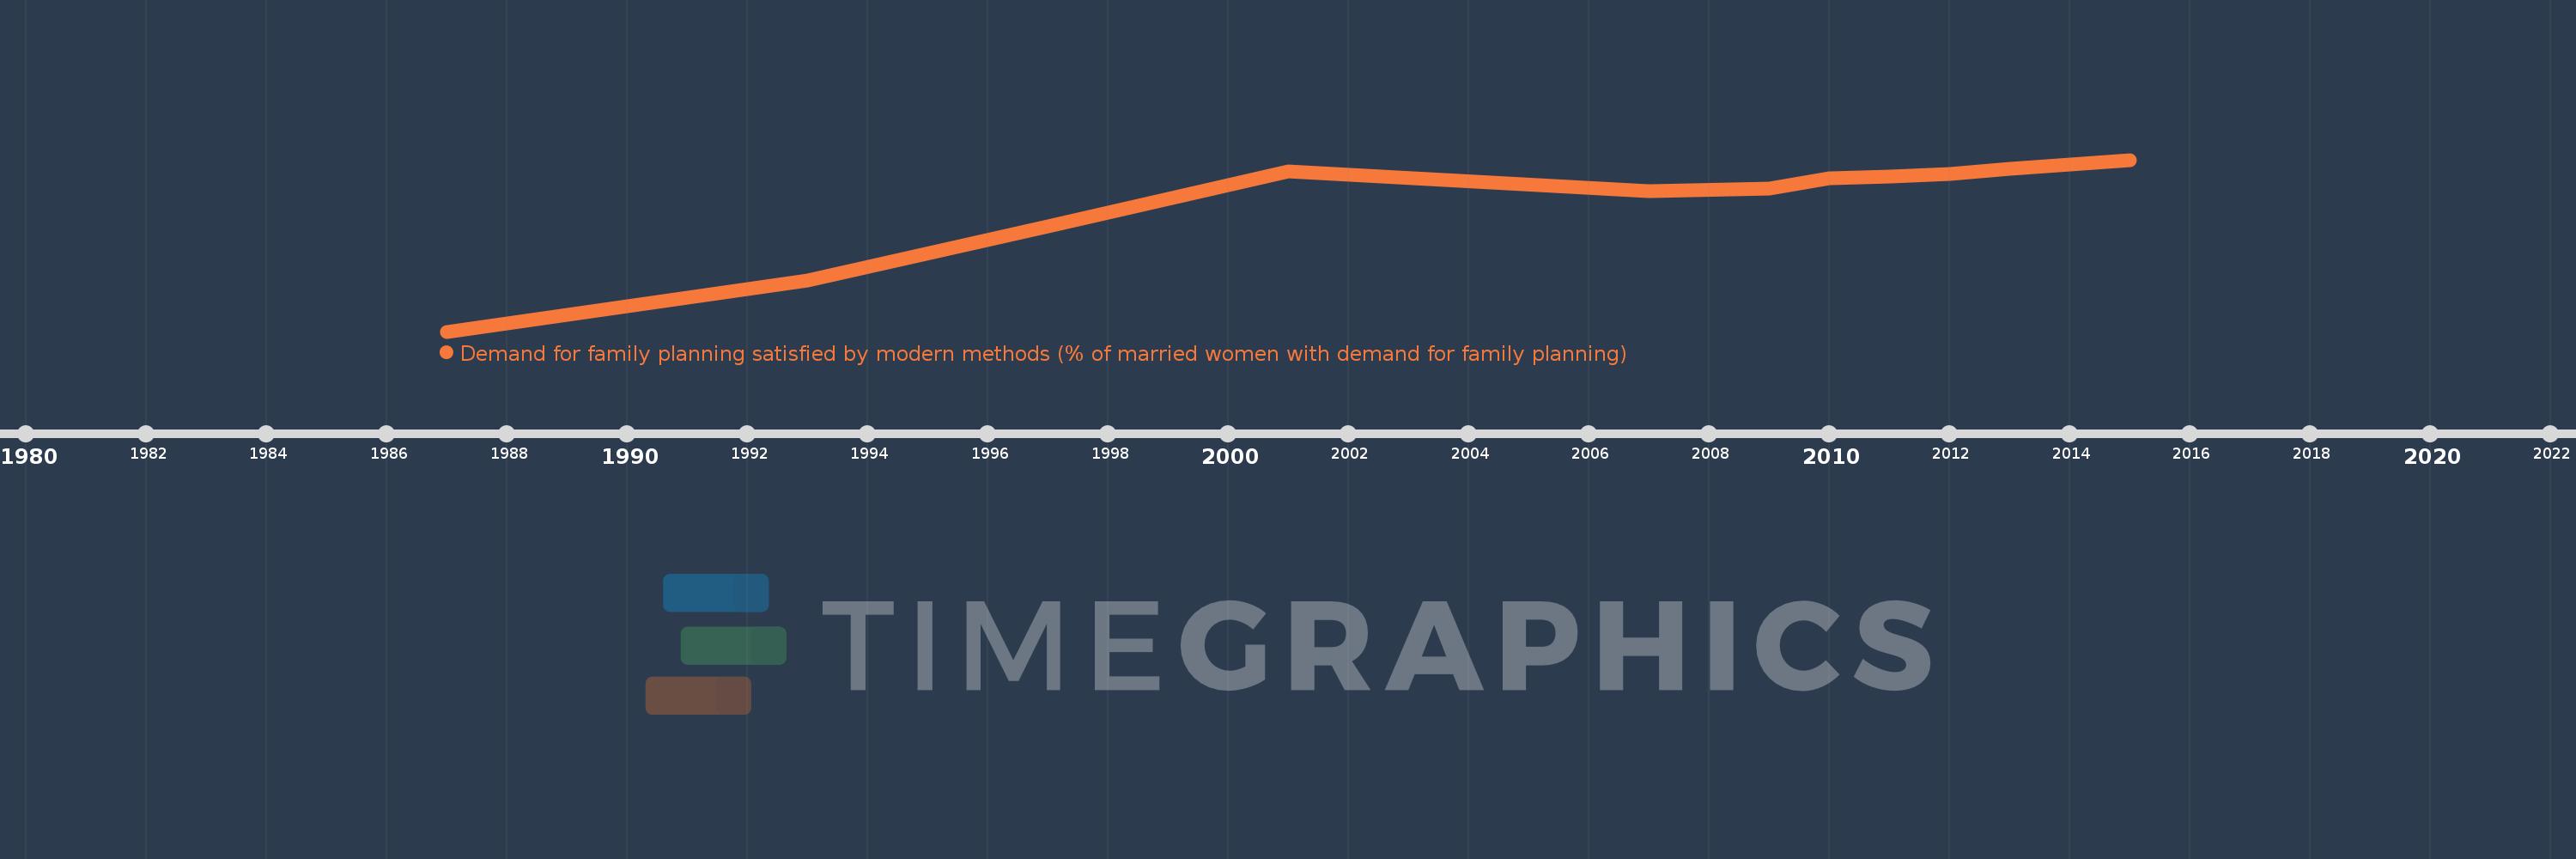
Demand for family planning satisfied by modern methods (% of married women with demand for family planning)
2015,2014,2013,2012,2011,2010,2009,2007,2001,1997,1993,1987