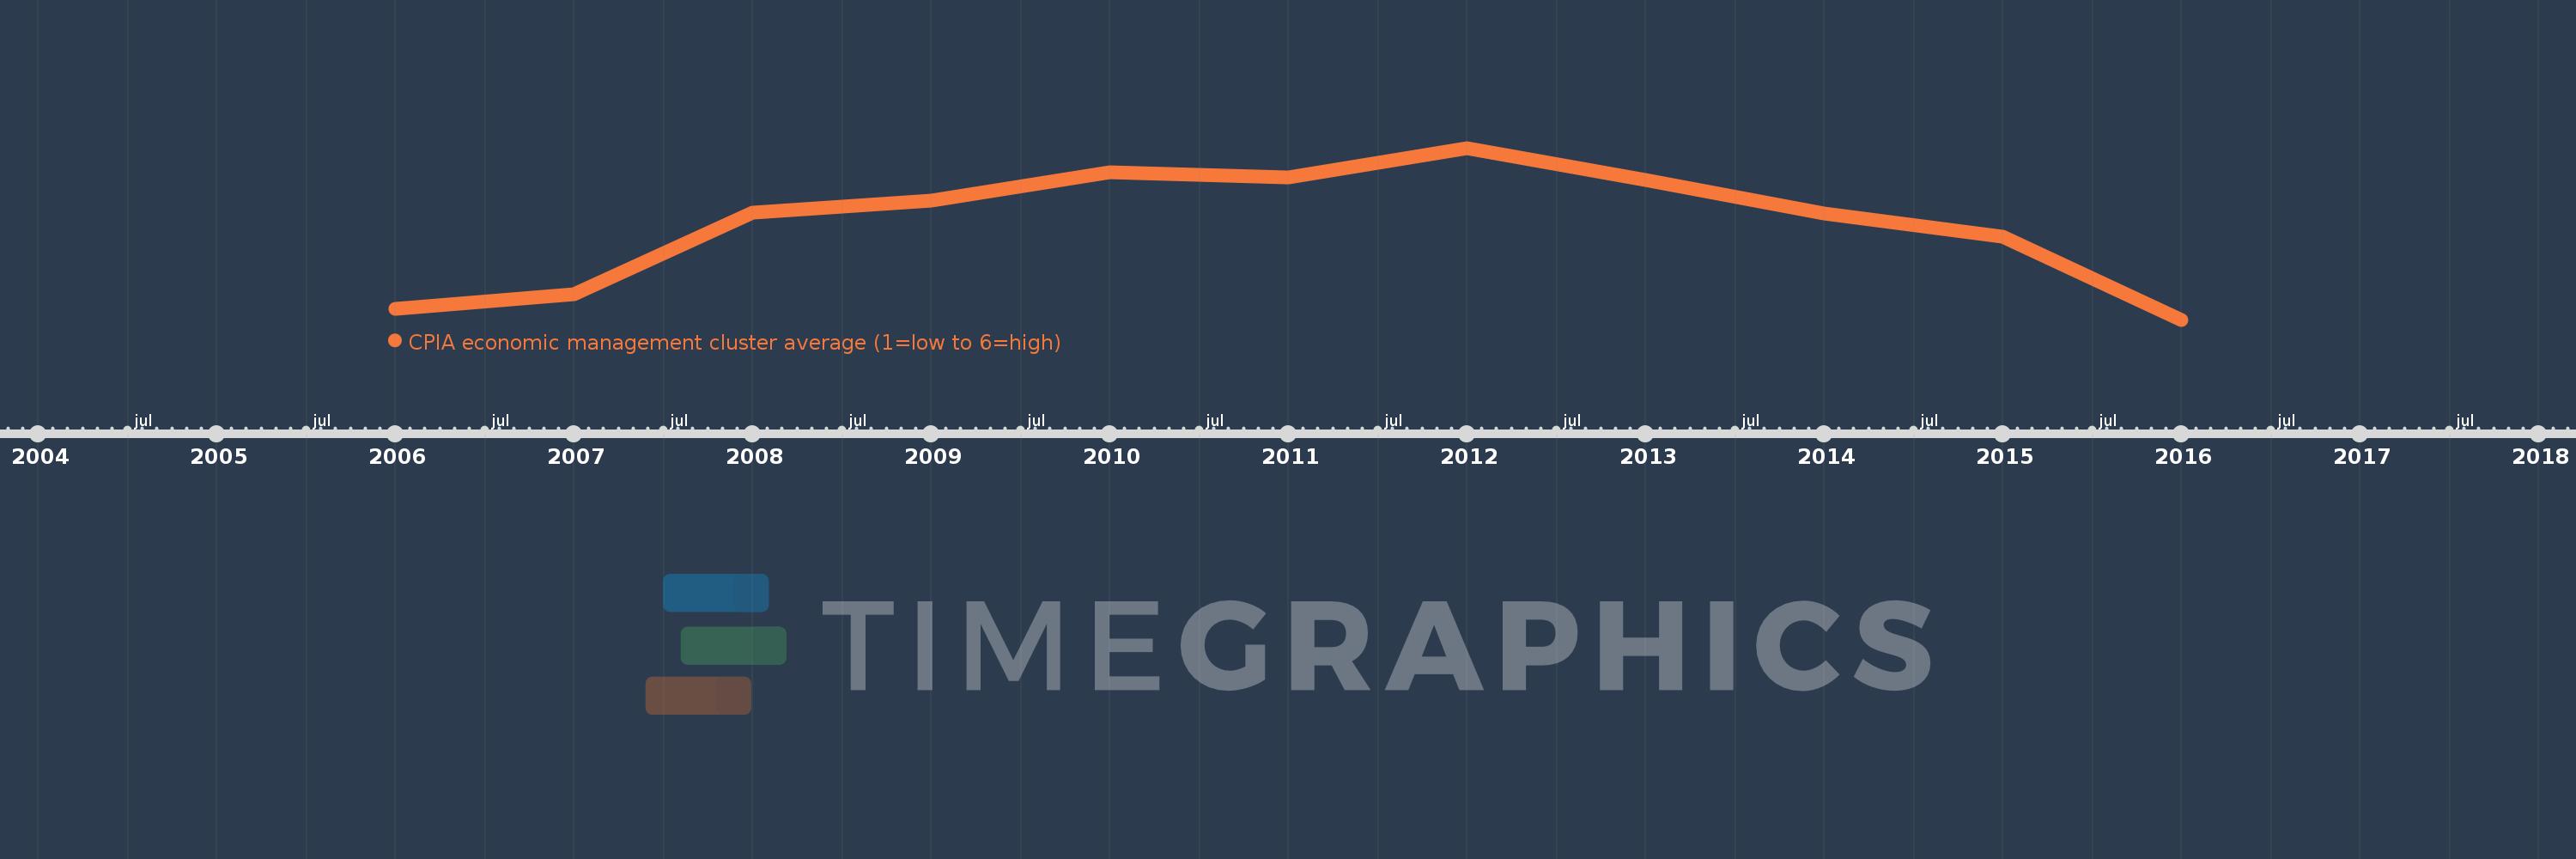
This timeline shows a graph from 2006 to 2016 of Sub-Saharan Africa (IDA & IBRD countries). No data until 2005. Number of actual observations by date: 11.
Source name:
World Development Indicators
Source organization:
World Bank Group, CPIA database (http://www.worldbank.org/ida).
Categories, topics:
Public Sector
Last updated:
apr 23, 2017
Indicators value changes by year
Meaning:
3.347
Minimum:
3.276
jan 1, 2016
Maximum:
3.404
jan 1, 2012
At the date of observation
Value
Absolute change
Change from the previous value
jan 1, 2006
3.284
+3.284
0.0%
jan 1, 2007
3.295
+0.011
0.33%
jan 1, 2008
3.356
+0.061
1.86%
jan 1, 2009
3.365
+0.009
0.27%
jan 1, 2010
3.386
+0.021
0.63%
jan 1, 2011
3.382
-0.004
-0.13%
jan 1, 2012
3.404
+0.022
0.65%
jan 1, 2013
3.38
-0.023
-0.68%
jan 1, 2014
3.355
-0.026
-0.76%
jan 1, 2015
3.338
-0.017
-0.51%
jan 1, 2016
3.276
-0.061
-1.84%
Ranking of countries by current statistics by years