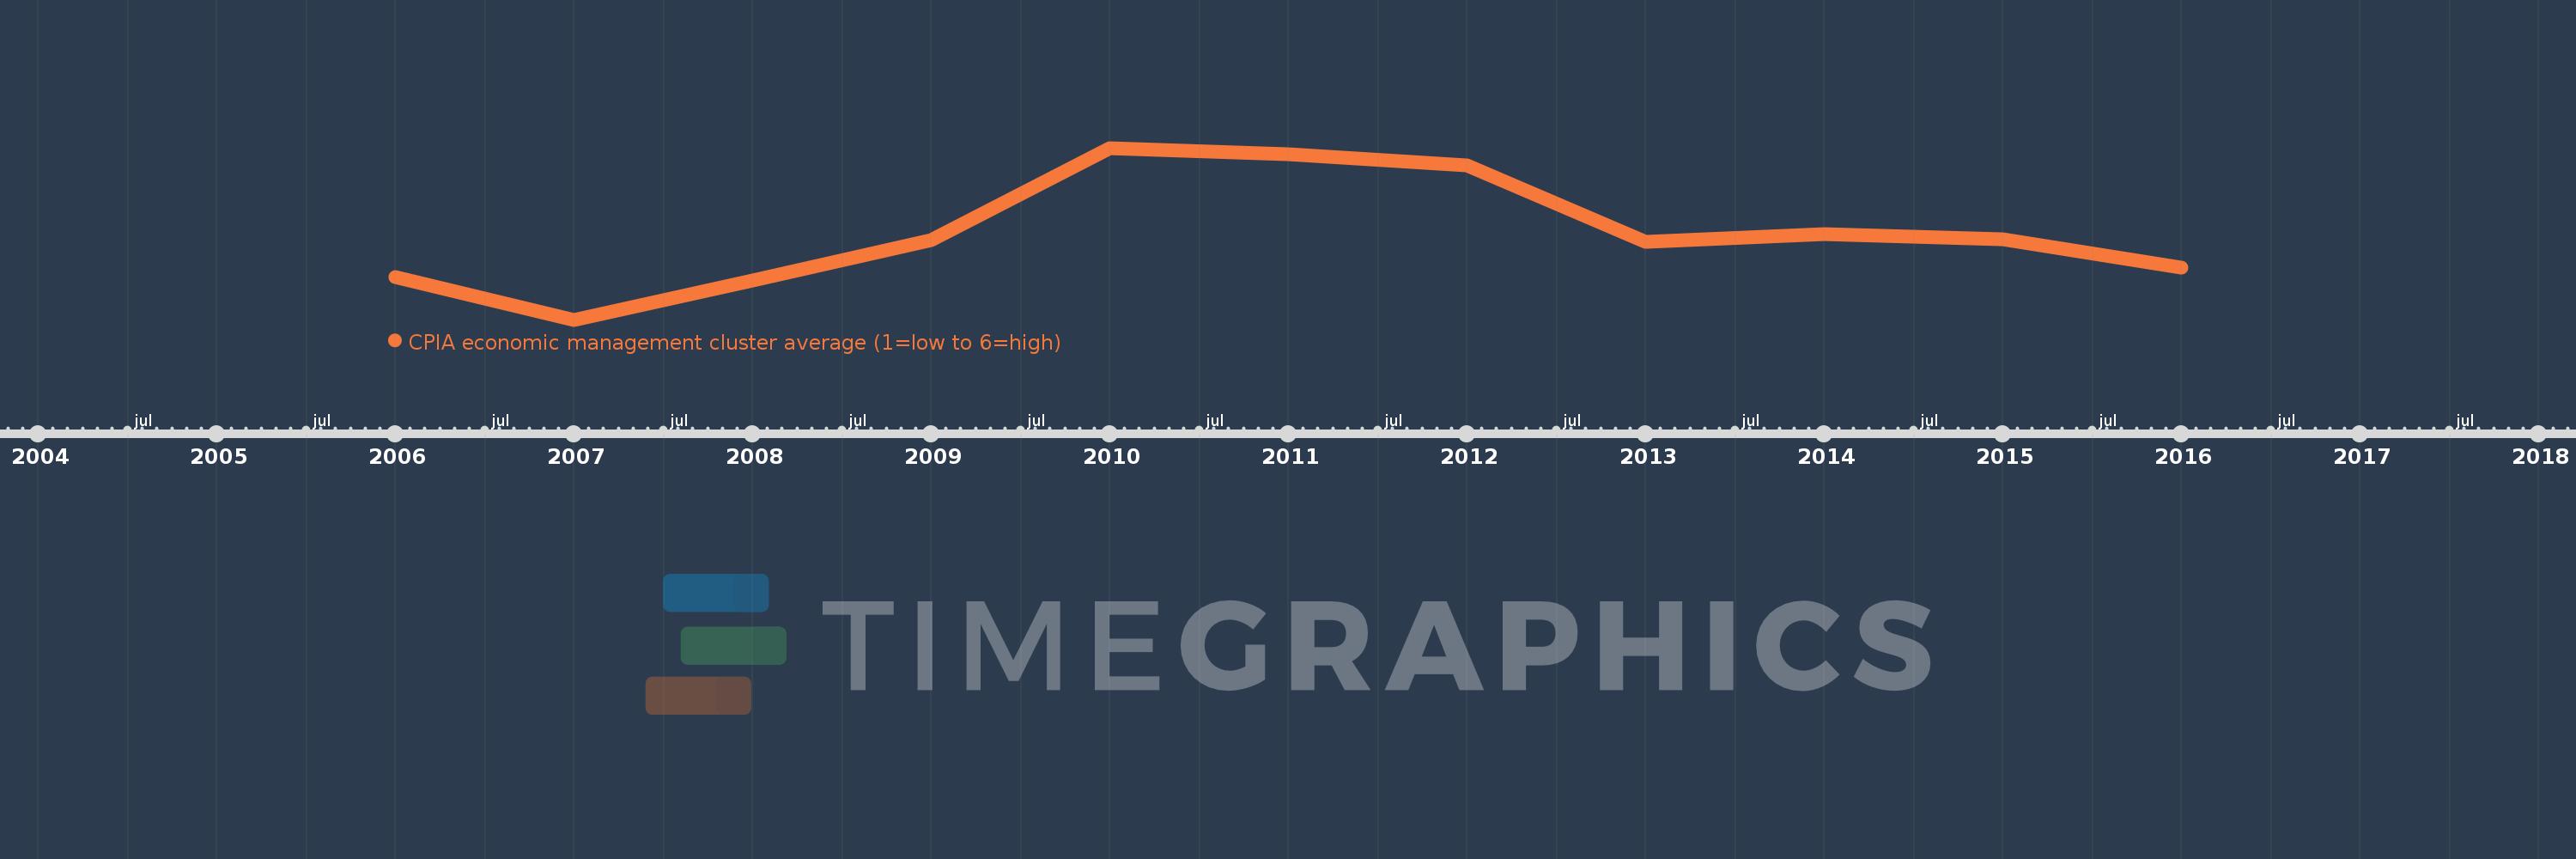
This timeline shows a graph from 2006 to 2016 of Fragile and conflict affected situations. No data until 2005. Number of actual observations by date: 11.
Source name:
World Development Indicators
Source organization:
World Bank Group, CPIA database (http://www.worldbank.org/ida).
Categories, topics:
Public Sector
Last updated:
apr 23, 2017
Indicators value changes by year
Meaning:
2.966
Minimum:
2.876
jan 1, 2007
Maximum:
3.056
jan 1, 2010
At the date of observation
Value
Absolute change
Change from the previous value
jan 1, 2006
2.921
+2.921
0.0%
jan 1, 2007
2.876
-0.045
-1.54%
jan 1, 2008
2.917
+0.041
1.42%
jan 1, 2009
2.959
+0.042
1.45%
jan 1, 2010
3.056
+0.096
3.26%
jan 1, 2011
3.049
-0.007
-0.23%
jan 1, 2012
3.038
-0.01
-0.33%
jan 1, 2013
2.958
-0.08
-2.64%
jan 1, 2014
2.966
+0.007
0.24%
jan 1, 2015
2.96
-0.006
-0.19%
jan 1, 2016
2.931
-0.029
-0.97%
Ranking of countries by current statistics by years