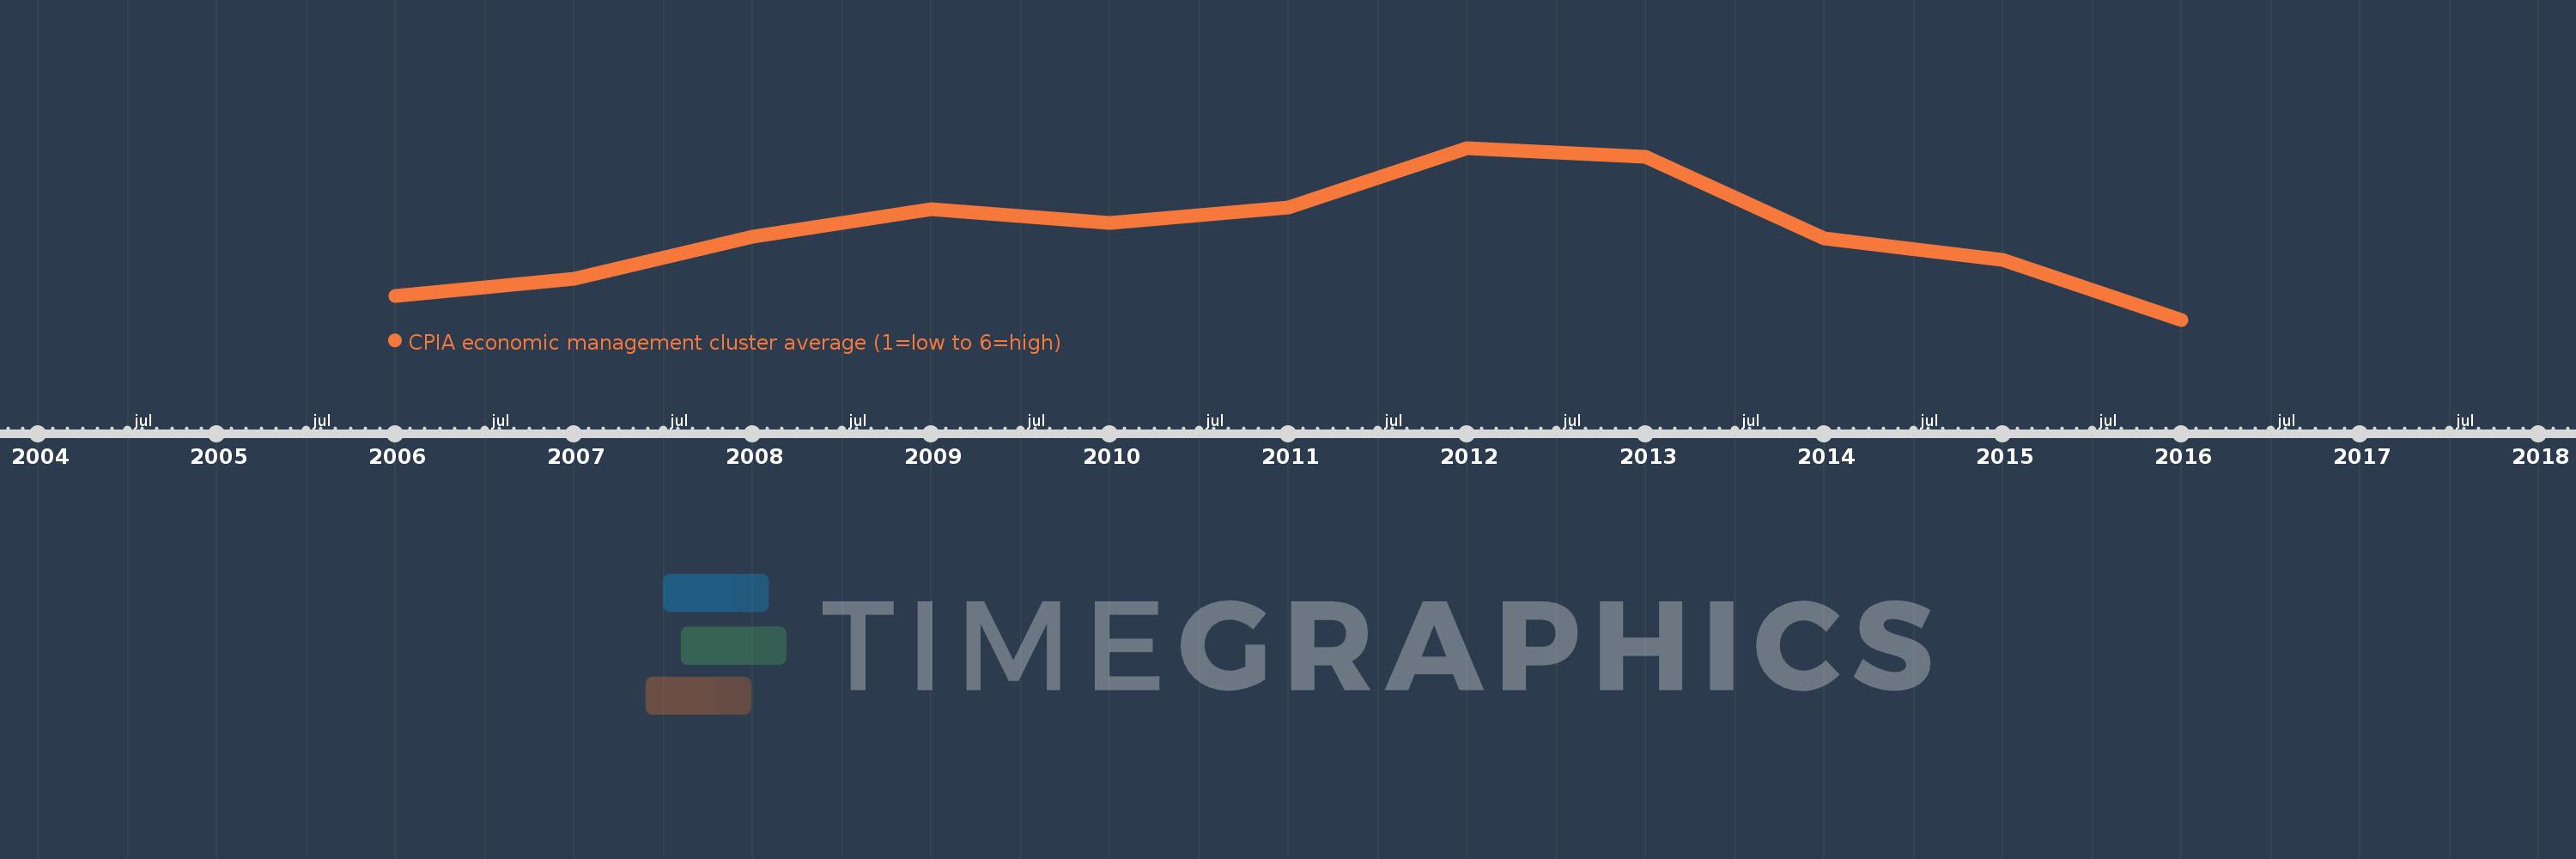
This timeline shows a graph from 2006 to 2016 of Heavily indebted poor countries (HIPC). No data until 2005. Number of actual observations by date: 11.
Source name:
World Development Indicators
Source organization:
World Bank Group, CPIA database (http://www.worldbank.org/ida).
Categories, topics:
Public Sector
Last updated:
apr 23, 2017
Indicators value changes by year
Meaning:
3.388
Minimum:
3.338
jan 1, 2016
Maximum:
3.439
jan 1, 2012
At the date of observation
Value
Absolute change
Change from the previous value
jan 1, 2006
3.352
+3.352
0.0%
jan 1, 2007
3.362
+0.01
0.31%
jan 1, 2008
3.387
+0.025
0.75%
jan 1, 2009
3.403
+0.015
0.45%
jan 1, 2010
3.395
-0.008
-0.23%
jan 1, 2011
3.404
+0.009
0.26%
jan 1, 2012
3.439
+0.035
1.03%
jan 1, 2013
3.434
-0.004
-0.13%
jan 1, 2014
3.386
-0.048
-1.4%
jan 1, 2015
3.373
-0.013
-0.39%
jan 1, 2016
3.338
-0.035
-1.04%
Ranking of countries by current statistics by years