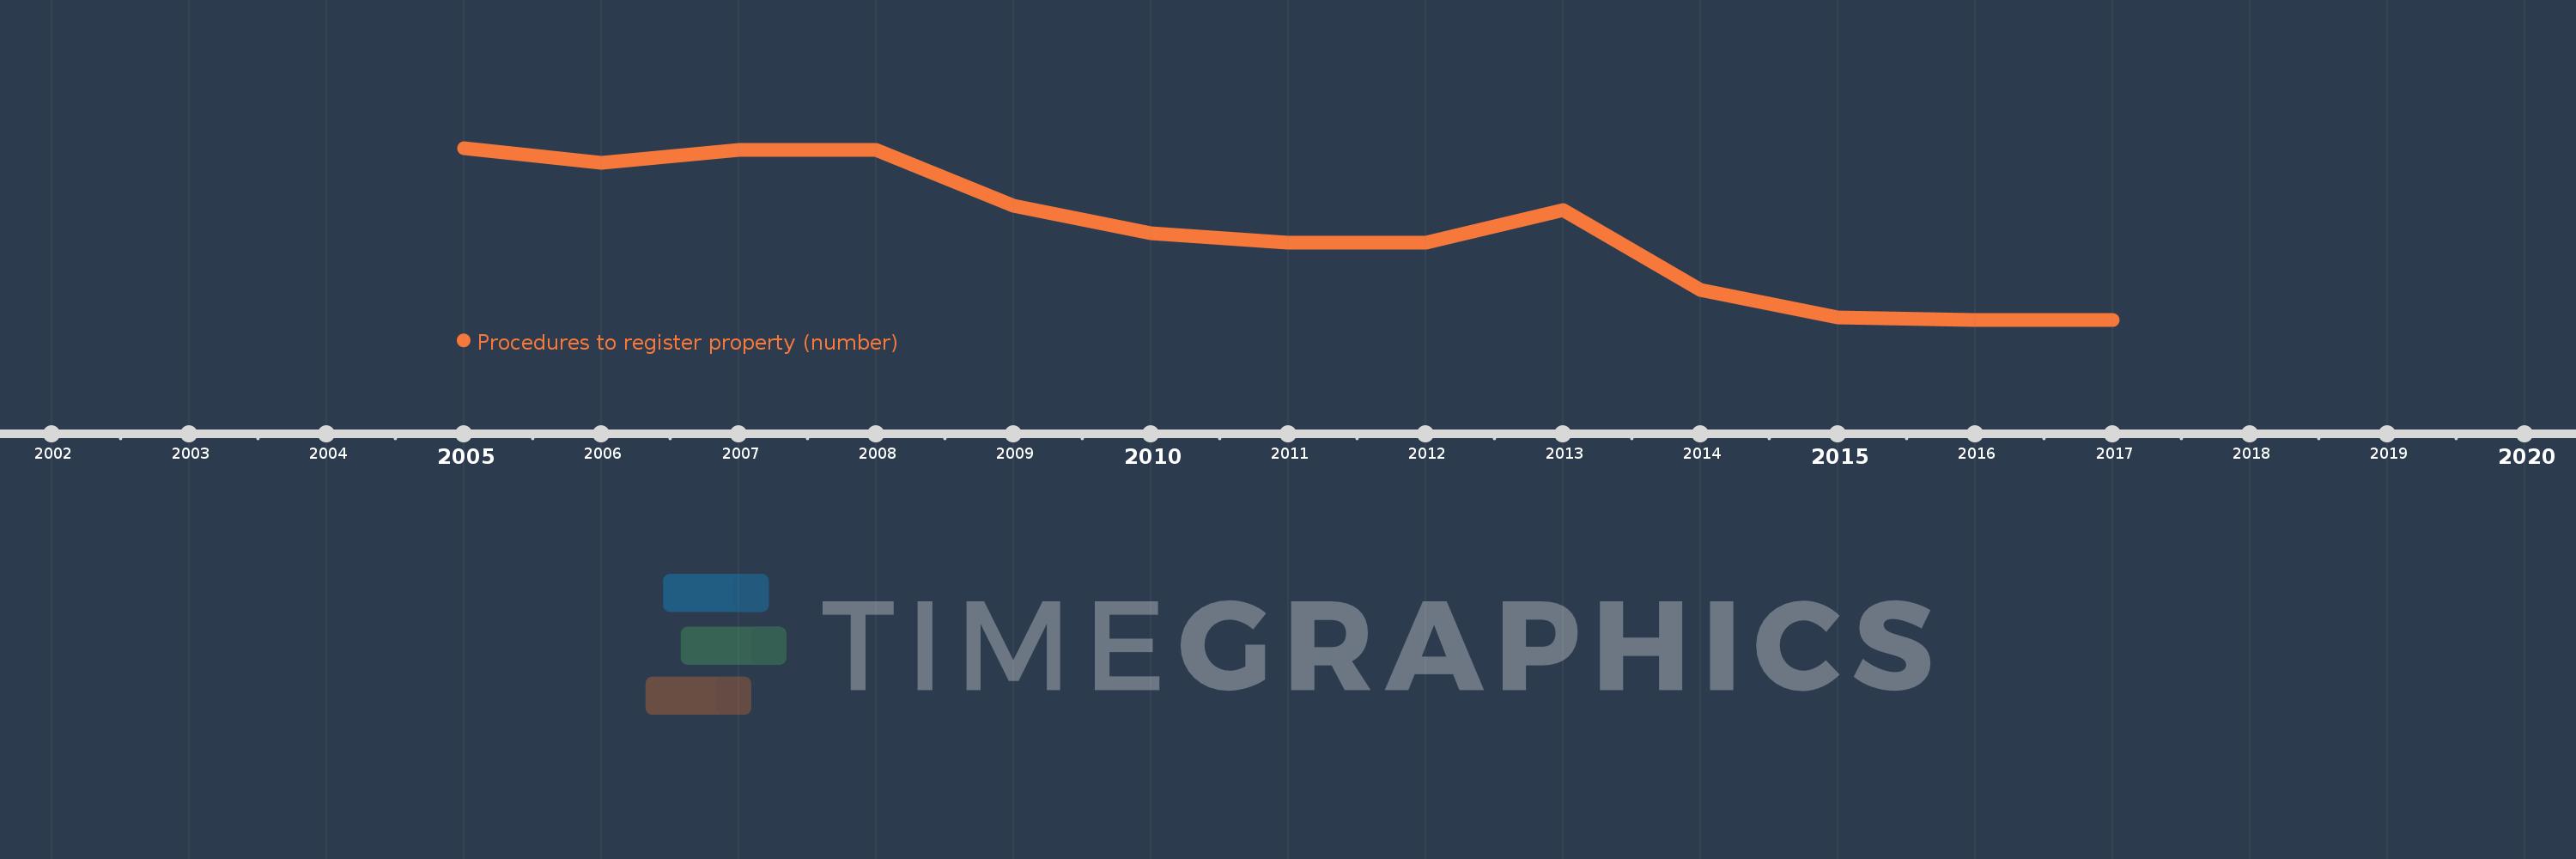
This timeline shows a graph from 2005 to 2017 of Sub-Saharan Africa (excluding high income). No data until 2004. Number of actual observations by date: 13.
Source name:
World Development Indicators
Source organization:
World Bank, Doing Business project (http://www.doingbusiness.org/).
Categories, topics:
Private Sector
Last updated:
apr 23, 2017
Indicators value changes by year
Meaning:
6.452
Minimum:
6.236
jan 1, 2016
Maximum:
6.649
jan 1, 2005
At the date of observation
Value
Absolute change
Change from the previous value
jan 1, 2005
6.649
+6.649
0.0%
jan 1, 2006
6.614
-0.035
-0.53%
jan 1, 2007
6.644
+0.031
0.47%
jan 1, 2008
6.644
0.0
0.0%
jan 1, 2009
6.511
-0.133
-2.01%
jan 1, 2010
6.444
-0.067
-1.02%
jan 1, 2011
6.422
-0.022
-0.34%
jan 1, 2012
6.422
0.0
0.0%
jan 1, 2013
6.5
+0.078
1.21%
jan 1, 2014
6.307
-0.193
-2.98%
jan 1, 2015
6.241
-0.065
-1.03%
jan 1, 2016
6.236
-0.005
-0.08%
jan 1, 2017
6.236
0.0
0.0%
Ranking of countries by current statistics by years