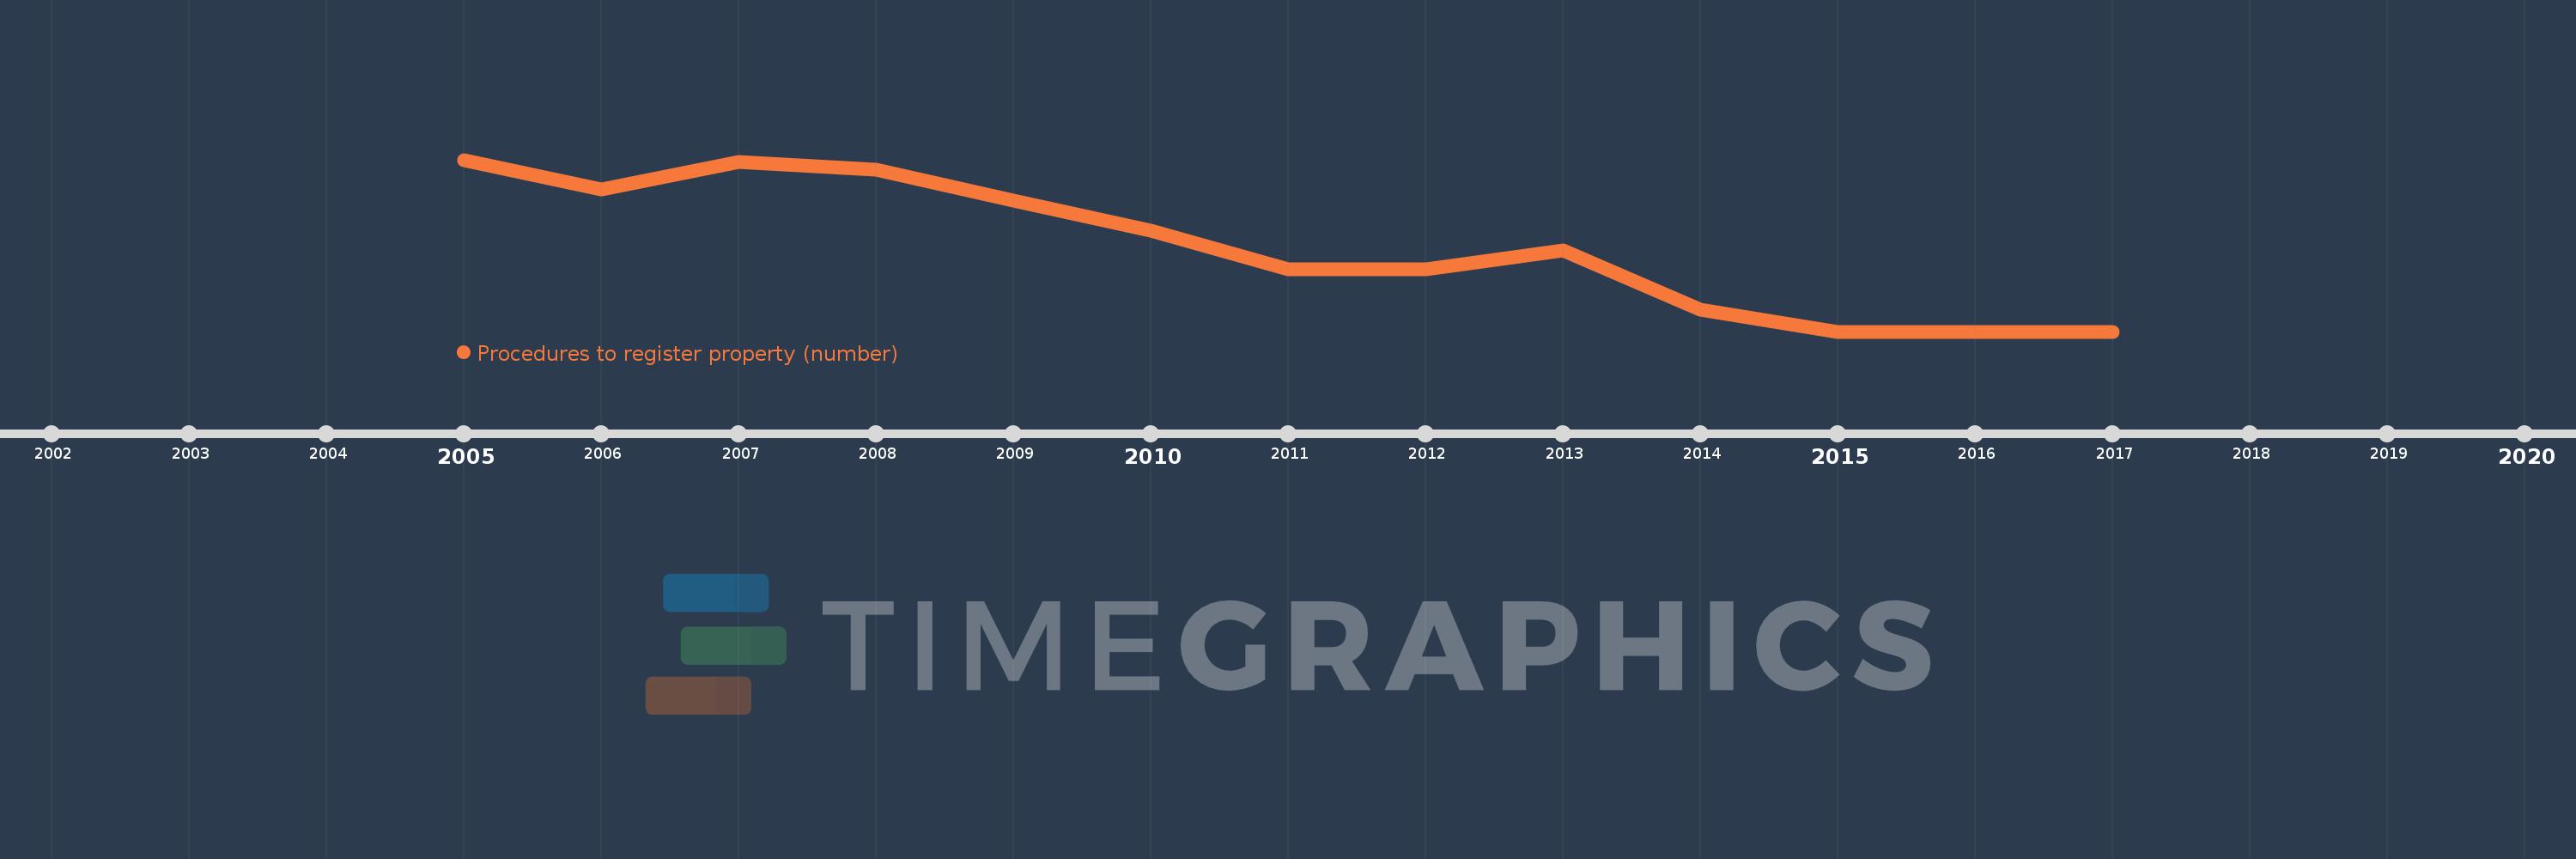
This timeline shows a graph from 2005 to 2017 of Least developed countries: UN classification. No data until 2004. Number of actual observations by date: 13.
Source name:
World Development Indicators
Source organization:
World Bank, Doing Business project (http://www.doingbusiness.org/).
Categories, topics:
Private Sector
Last updated:
apr 23, 2017
Indicators value changes by year
Meaning:
6.279
Minimum:
6.022
jan 1, 2016
Maximum:
6.541
jan 1, 2005
At the date of observation
Value
Absolute change
Change from the previous value
jan 1, 2005
6.541
+6.541
0.0%
jan 1, 2006
6.452
-0.088
-1.35%
jan 1, 2007
6.535
+0.083
1.28%
jan 1, 2008
6.512
-0.023
-0.36%
jan 1, 2009
6.419
-0.093
-1.43%
jan 1, 2010
6.326
-0.093
-1.45%
jan 1, 2011
6.209
-0.116
-1.84%
jan 1, 2012
6.209
0.0
0.0%
jan 1, 2013
6.267
+0.057
0.92%
jan 1, 2014
6.089
-0.178
-2.84%
jan 1, 2015
6.022
-0.067
-1.09%
jan 1, 2016
6.022
0.0
-0.01%
jan 1, 2017
6.022
0.0
0.0%
Ranking of countries by current statistics by years