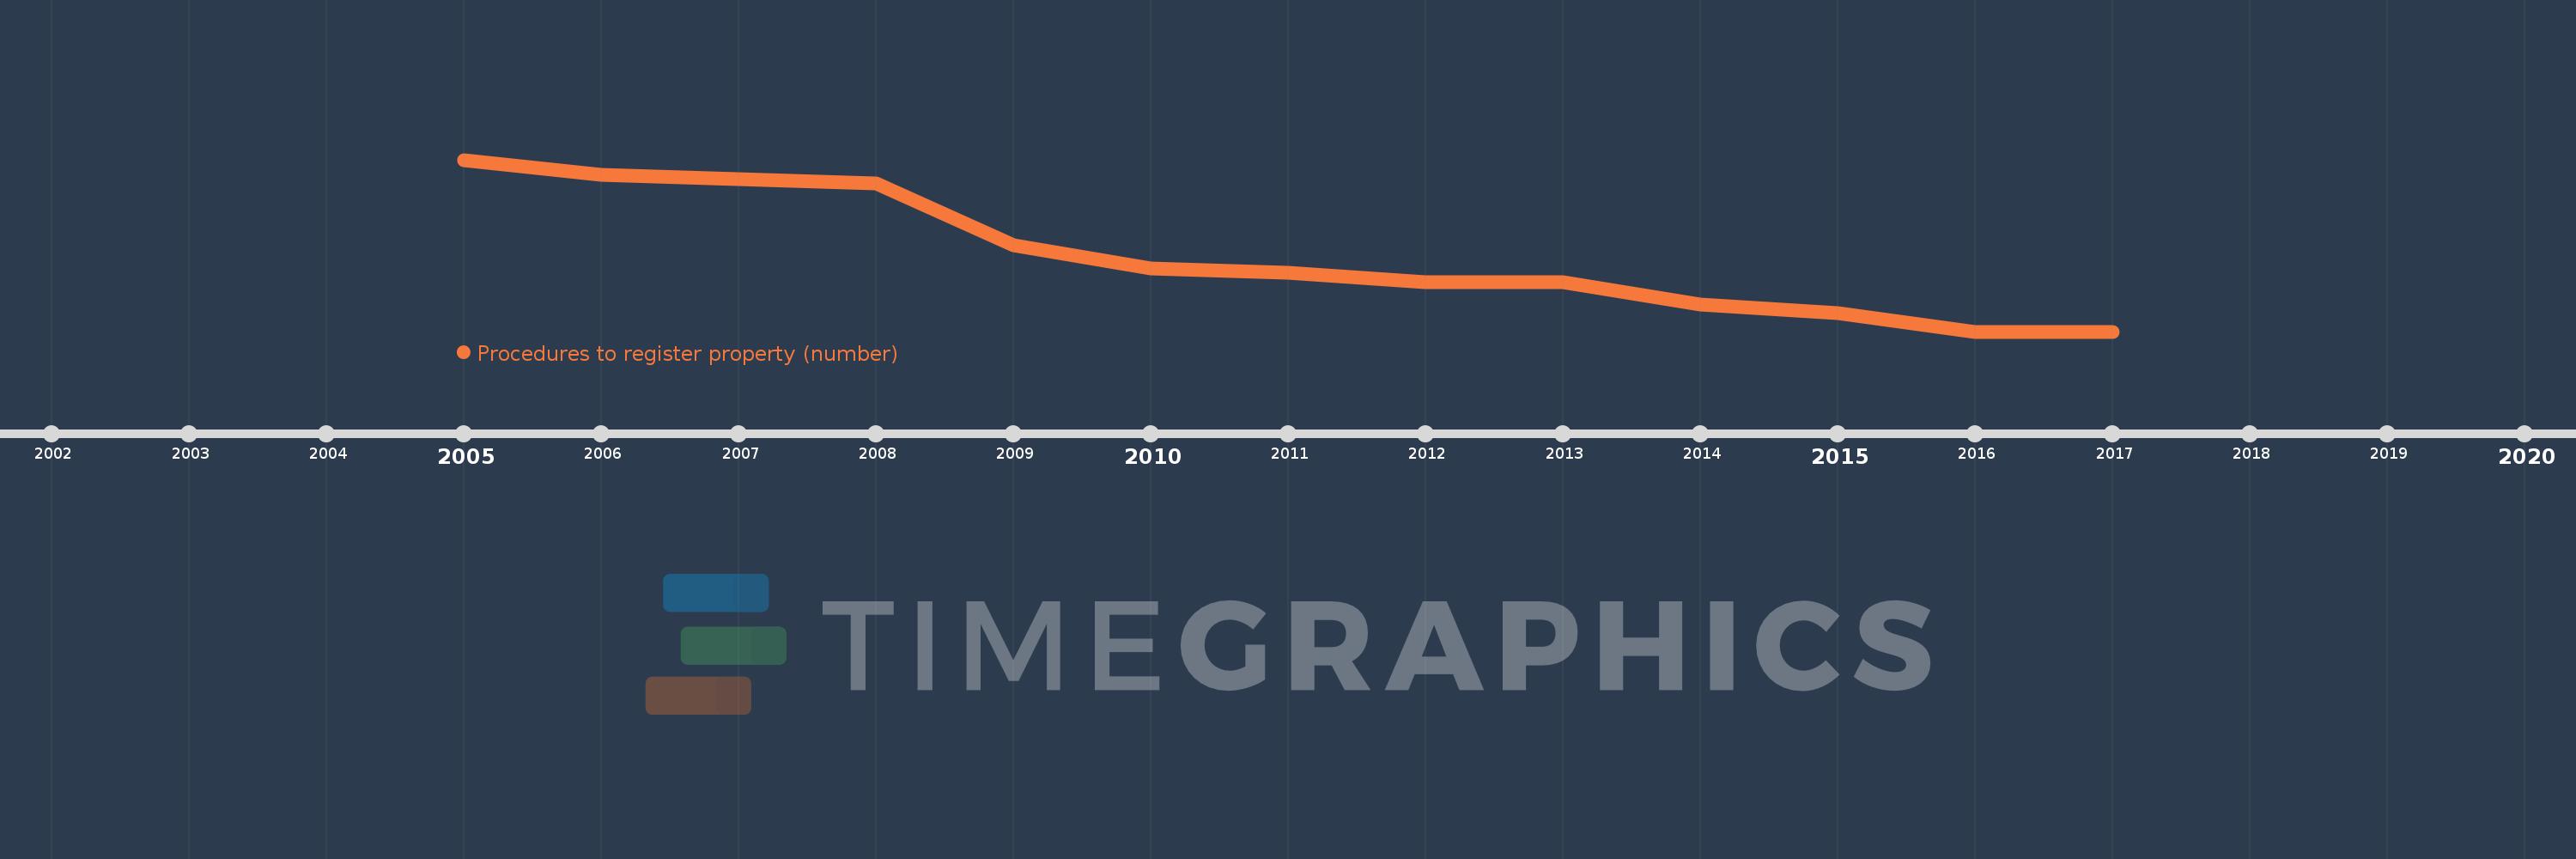
This timeline shows a graph from 2005 to 2017 of Europe & Central Asia (IDA & IBRD countries). No data until 2004. Number of actual observations by date: 13.
Source name:
World Development Indicators
Source organization:
World Bank, Doing Business project (http://www.doingbusiness.org/).
Categories, topics:
Private Sector
Last updated:
apr 23, 2017
Indicators value changes by year
Meaning:
6.033
Minimum:
5.273
jan 1, 2016
Maximum:
7.0
jan 1, 2005
At the date of observation
Value
Absolute change
Change from the previous value
jan 1, 2005
7.0
+7.0
0.0%
jan 1, 2006
6.85
-0.15
-2.14%
jan 1, 2007
6.81
-0.04
-0.59%
jan 1, 2008
6.762
-0.048
-0.7%
jan 1, 2009
6.143
-0.619
-9.15%
jan 1, 2010
5.909
-0.234
-3.81%
jan 1, 2011
5.864
-0.045
-0.77%
jan 1, 2012
5.773
-0.091
-1.55%
jan 1, 2013
5.773
0.0
0.0%
jan 1, 2014
5.545
-0.227
-3.94%
jan 1, 2015
5.455
-0.091
-1.64%
jan 1, 2016
5.273
-0.182
-3.33%
jan 1, 2017
5.273
0.0
0.0%
Ranking of countries by current statistics by years