29
/
en
AIzaSyAYiBZKx7MnpbEhh9jyipgxe19OcubqV5w
April 1, 2024
60069
Sub-Saharan Africa (excluding high income)
SSA
false
2
1
Net bilateral aid flows from DAC donors, Slovenia (current US$)
2015,2014,2013,2012,2011,2010,2009,2008,2007,2006,2005,2004
Download
Global statistics library →Sub-Saharan Africa (excluding high income) →

Net bilateral aid flows from DAC donors, Slovenia (current US$)

This statistics in other country:
AfghanistanAlbaniaAlgeriaArab WorldArgentinaBelarusBosnia and HerzegovinaBrazilBurkina FasoBurundiCabo VerdeCameroonCaribbean small statesCentral African RepublicCentral Europe and the BalticsChadChinaColombiaCongo, Dem. Rep.Congo, Rep.Costa RicaCroatiaCubaDominicaEast Asia & PacificEast Asia & Pacific (excluding high income)East Asia & Pacific (IDA & IBRD countries)Egypt, Arab Rep.EritreaEthiopiaEurope & Central AsiaEurope & Central Asia (excluding high income)Europe & Central Asia (IDA & IBRD countries)European UnionFragile and conflict affected situationsGeorgiaGhanaGuineaGuyanaHaitiHeavily indebted poor countries (HIPC)High incomeIBRD onlyIDA & IBRD totalIDA blendIDA onlyIDA totalIndiaIran, Islamic Rep.IraqJamaicaJordanKenyaKosovoKyrgyz RepublicLatin America & Caribbean Latin America & Caribbean (excluding high income)Latin America & the Caribbean (IDA & IBRD countries)Least developed countries: UN classificationLiberiaLibyaLow & middle incomeLow incomeLower middle incomeMacedonia, FYRMadagascarMalawiMalaysiaMaliMarshall IslandsMexicoMicronesia, Fed. Sts.Middle East & North AfricaMiddle East & North Africa (excluding high income)Middle East & North Africa (IDA & IBRD countries)Middle incomeMoldovaMontenegroMyanmarNepalNigerNigeriaOECD membersOther small statesPacific island small statesPakistanPalauPhilippinesRwandaSenegalSerbiaSeychellesSierra LeoneSmall statesSomaliaSouth AfricaSouth AsiaSouth Asia (IDA & IBRD)South SudanSri LankaSt. LuciaSt. Vincent and the GrenadinesSub-Saharan Africa Sub-Saharan Africa (excluding high income)Sub-Saharan Africa (IDA & IBRD countries)SudanSyrian Arab RepublicTajikistanTunisiaTurkeyUgandaUkraineUpper middle incomeUzbekistanVenezuela, RBWest Bank and GazaWorldZimbabwe
Timeline:
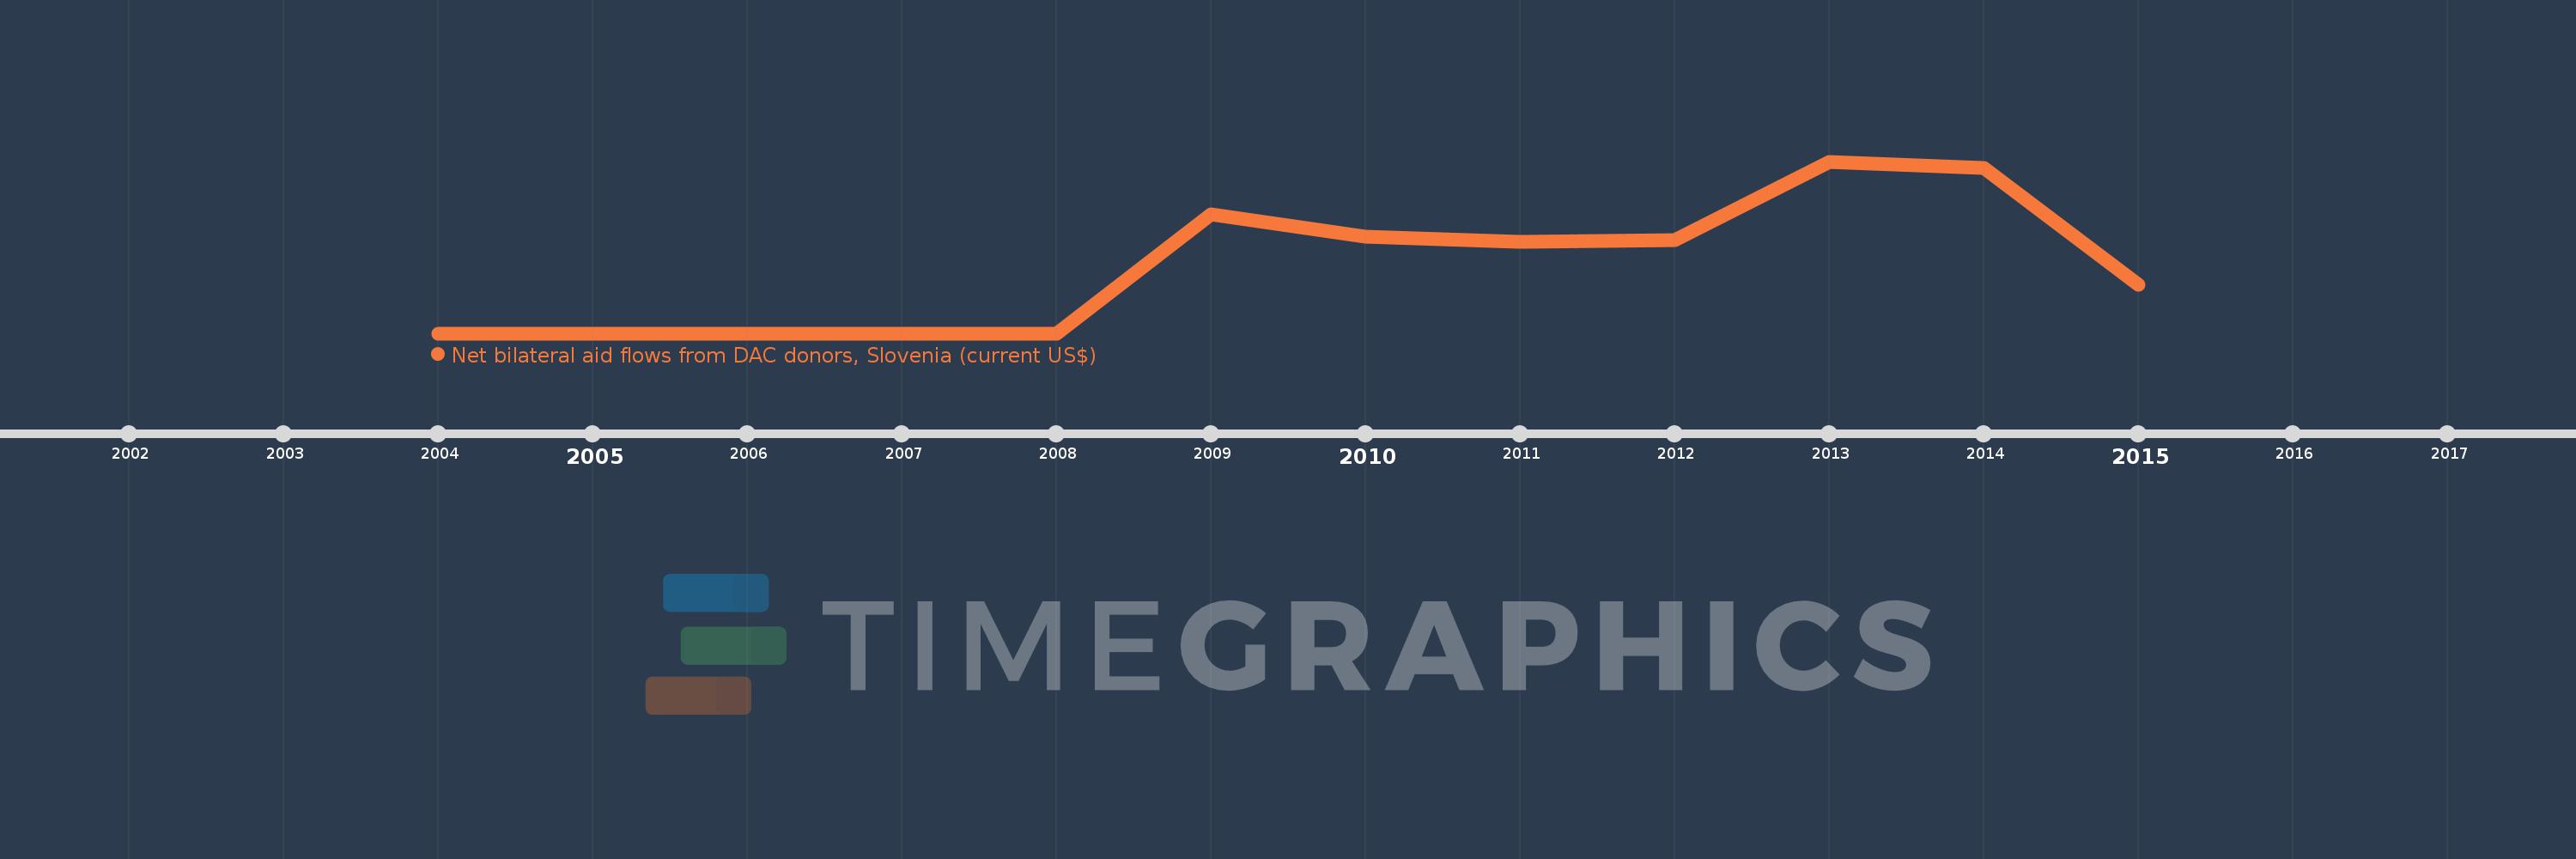
This timeline shows a graph from 2004 to 2015 of Sub-Saharan Africa (excluding high income). No data until 2003. Number of actual observations by date: 12.
Source name:
World Development Indicators
Source organization:
Development Assistance Committee of the Organisation for Economic Co-operation and Development, Geographical Distribution of Financial Flows to Developing Countries, Development Co-operation Report, and International Development Statistics database. Data are available online at: www.oecd.org/dac/stats/idsonline.
Categories, topics:
Aid Effectiveness
Last updated:
apr 23, 2017
Indicators value changes by year
Mean:
407.5K
Minimum:
0.0
jan 1, 2004
Maximum:
1.07 mln
jan 1, 2013
At the date of observation
Value
Absolute change
Change from previous value
jan 1, 2004
0.0
0.0
0.0%
jan 1, 2005
0.0
0.0
%
jan 1, 2006
0.0
0.0
%
jan 1, 2007
0.0
0.0
%
jan 1, 2008
0.0
0.0
%
jan 1, 2009
740.0K
+740.0K
%
jan 1, 2010
600.0K
-140.0K
-18.92%
jan 1, 2011
570.0K
-30.0K
-5.0%
jan 1, 2012
580.0K
+10.0K
1.75%
jan 1, 2013
1.07 mln
+490.0K
84.48%
jan 1, 2014
1.03 mln
-40.0K
-3.74%
jan 1, 2015
300.0K
-730.0K
-70.87%
Ranking of countries by current statistics by years

Comments:

Send
PremiumAbout & FeedbackTermsPrivacy
logo
© 2022 Selected Technologies LLC – Morgan Hill, California