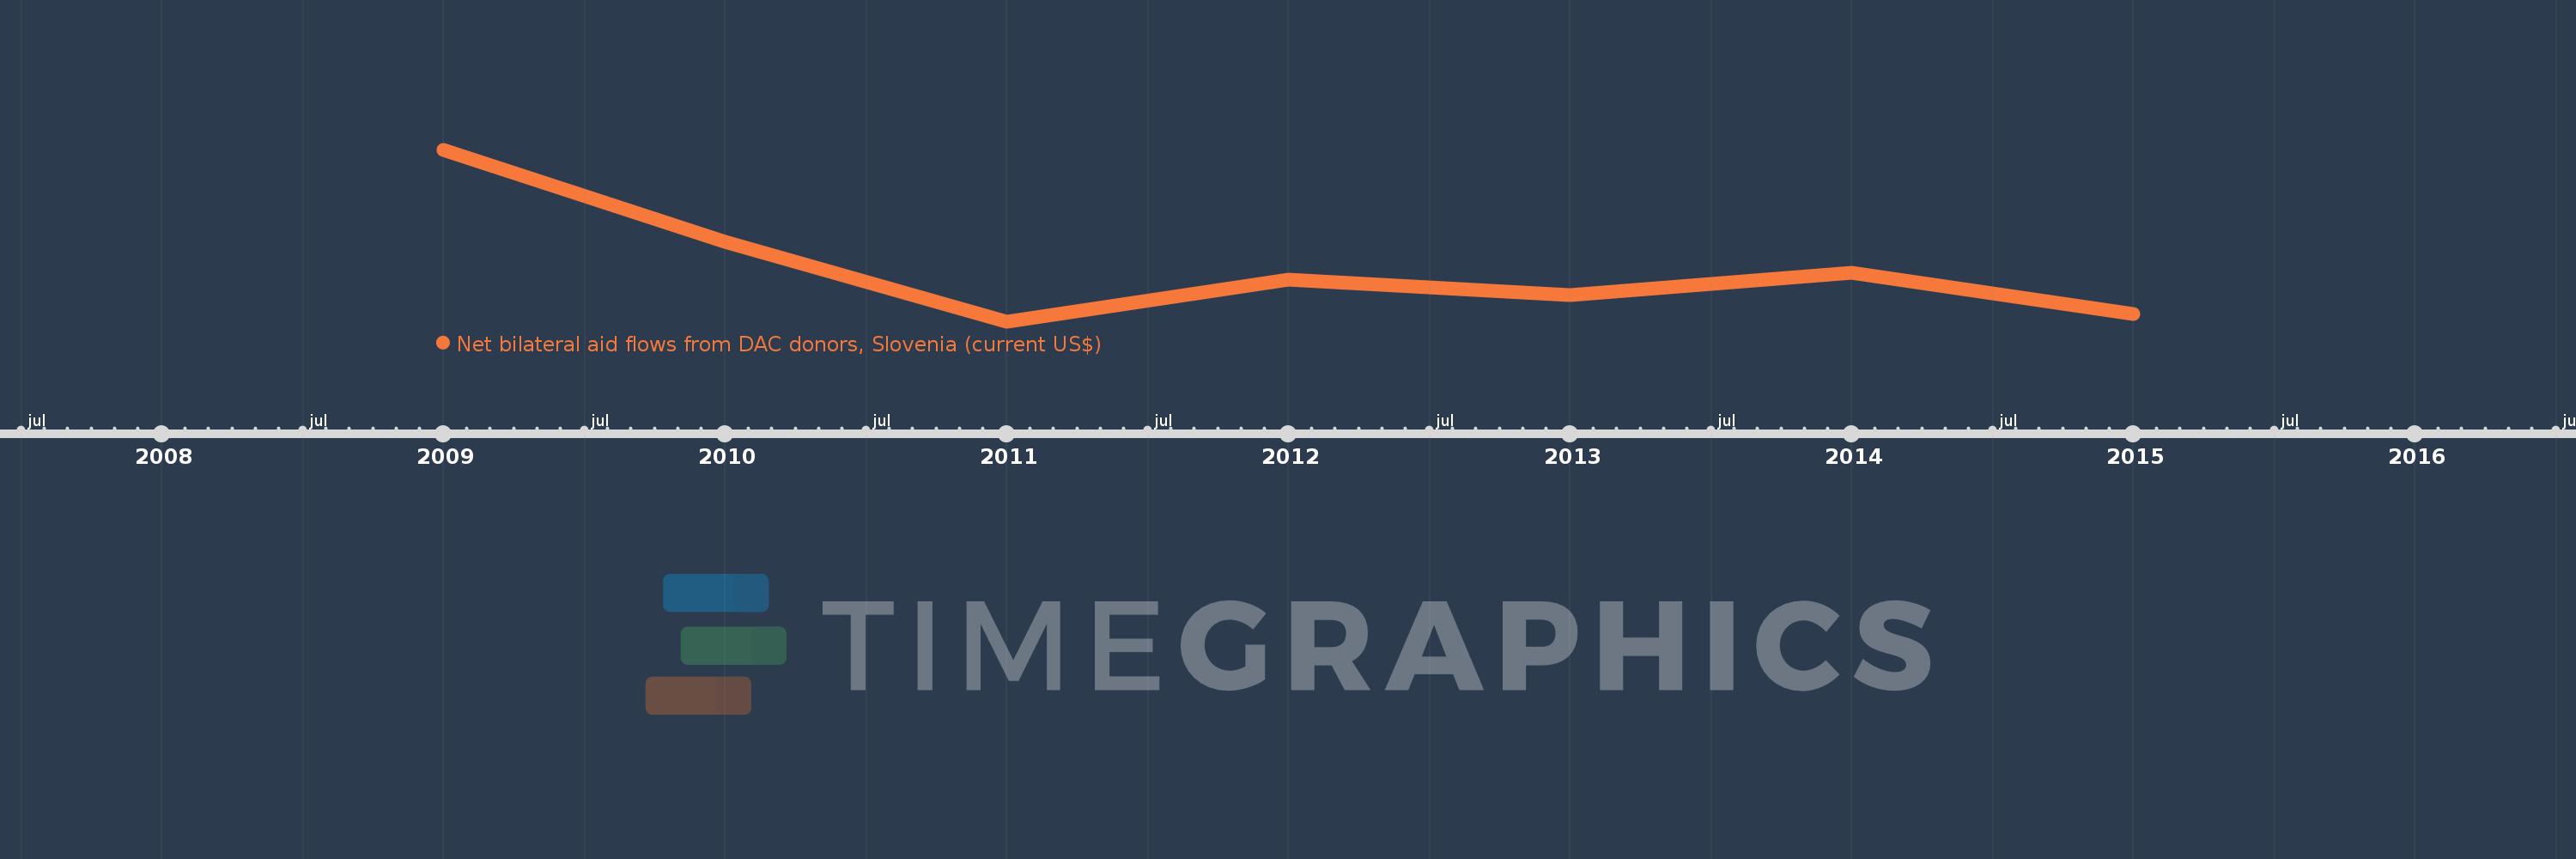
This timeline shows a graph from 2009 to 2015 of Middle East & North Africa (IDA & IBRD countries). No data until 2008. Number of actual observations by date: 7.
Source name:
World Development Indicators
Source organization:
Development Assistance Committee of the Organisation for Economic Co-operation and Development, Geographical Distribution of Financial Flows to Developing Countries, Development Co-operation Report, and International Development Statistics database. Data are available online at: www.oecd.org/dac/stats/idsonline.
Categories, topics:
Aid Effectiveness
Last updated:
apr 23, 2017
Indicators value changes by year
Meaning:
211.429K
Minimum:
70.0K
jan 1, 2011
Maximum:
520.0K
jan 1, 2009
At the date of observation
Value
Absolute change
Change from the previous value
jan 1, 2009
520.0K
+520.0K
0.0%
jan 1, 2010
280.0K
-240.0K
-46.15%
jan 1, 2011
70.0K
-210.0K
-75.0%
jan 1, 2012
180.0K
+110.0K
157.14%
jan 1, 2013
140.0K
-40.0K
-22.22%
jan 1, 2014
200.0K
+60.0K
42.86%
jan 1, 2015
90.0K
-110.0K
-55.0%
Ranking of countries by current statistics by years