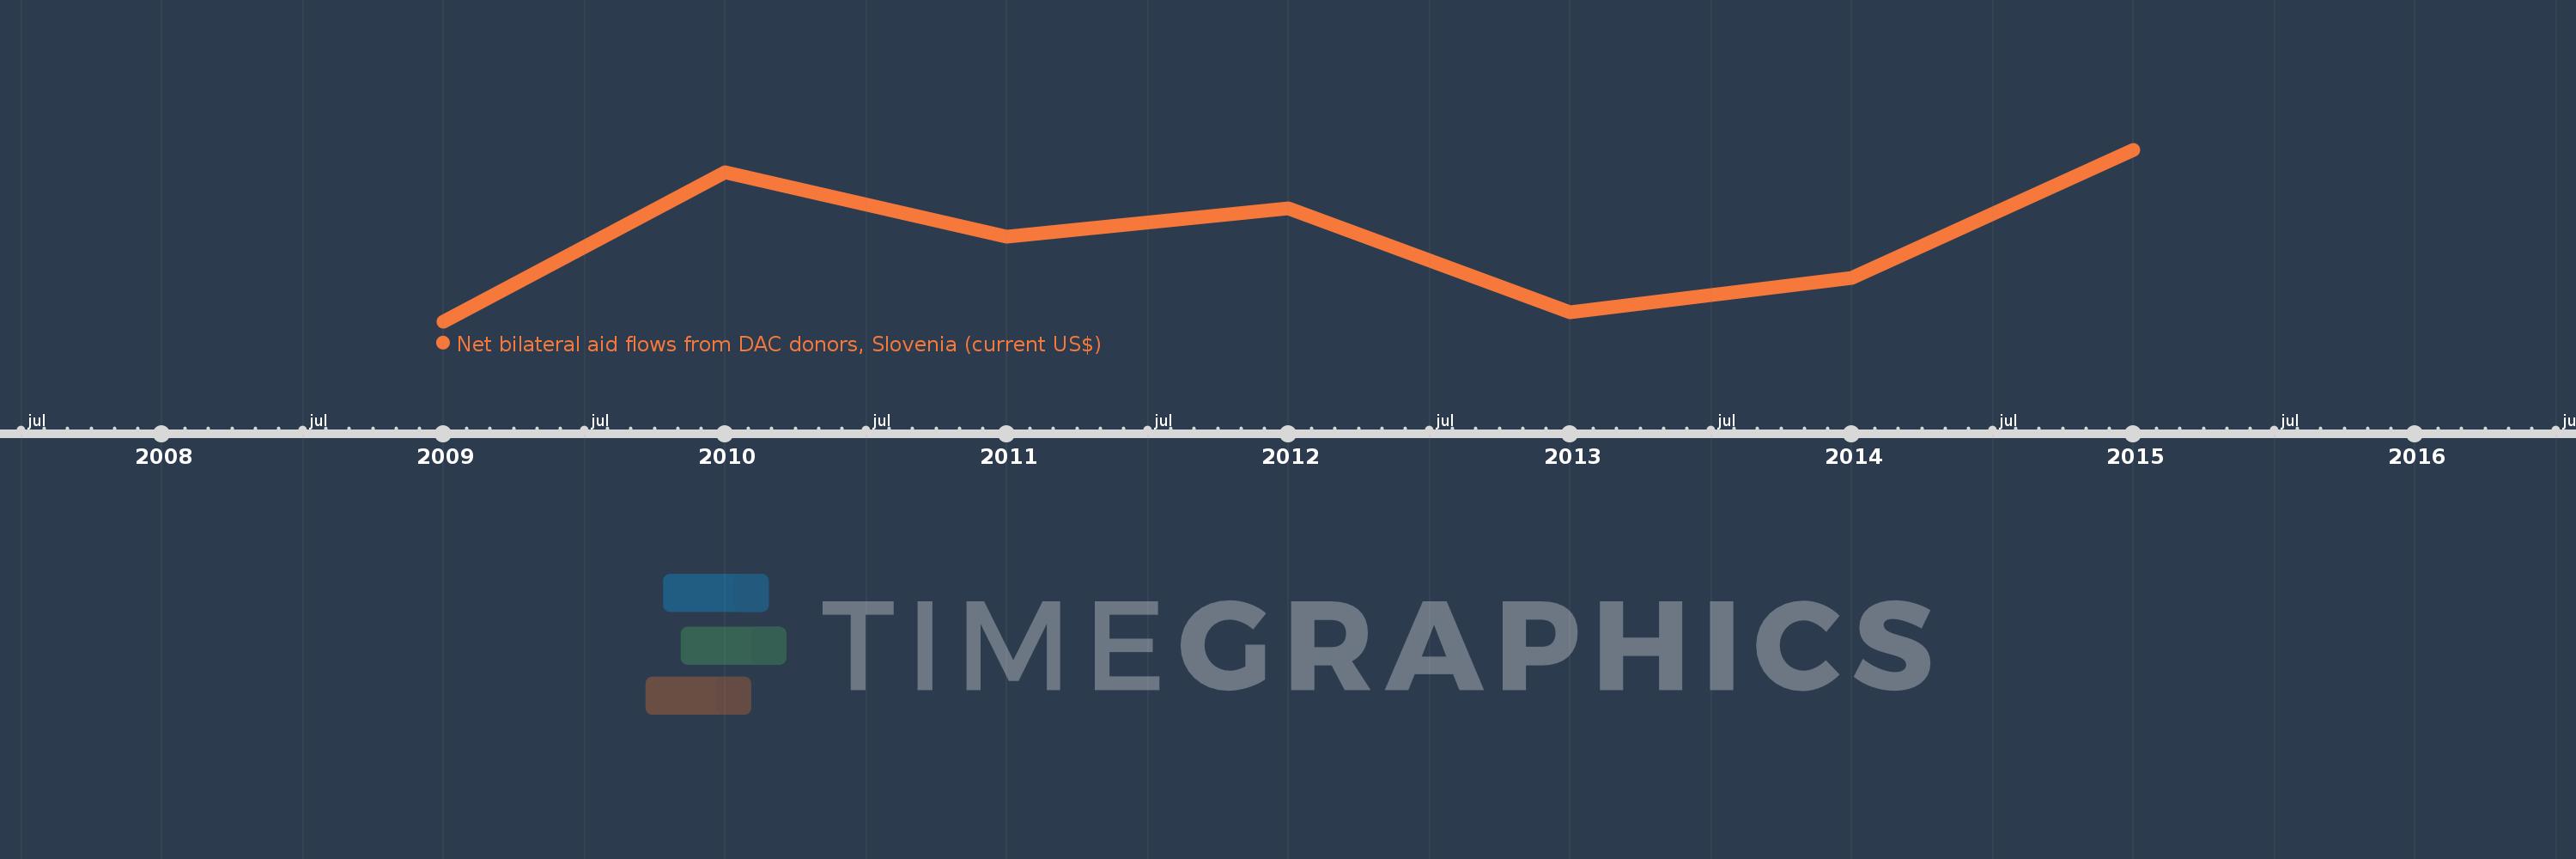
This timeline shows a graph from 2009 to 2015 of Fragile and conflict affected situations. No data until 2008. Number of actual observations by date: 7.
Source name:
World Development Indicators
Source organization:
Development Assistance Committee of the Organisation for Economic Co-operation and Development, Geographical Distribution of Financial Flows to Developing Countries, Development Co-operation Report, and International Development Statistics database. Data are available online at: www.oecd.org/dac/stats/idsonline.
Categories, topics:
Aid Effectiveness
Last updated:
apr 23, 2017
Indicators value changes by year
Meaning:
3.714 mln
Minimum:
2.75 mln
jan 1, 2009
Maximum:
4.77 mln
jan 1, 2015
At the date of observation
Value
Absolute change
Change from the previous value
jan 1, 2009
2.75 mln
+2.75 mln
0.0%
jan 1, 2010
4.51 mln
+1.76 mln
64.0%
jan 1, 2011
3.75 mln
-760.0K
-16.85%
jan 1, 2012
4.09 mln
+340.0K
9.07%
jan 1, 2013
2.86 mln
-1.23 mln
-30.07%
jan 1, 2014
3.27 mln
+410.0K
14.34%
jan 1, 2015
4.77 mln
+1.5 mln
45.87%
Ranking of countries by current statistics by years