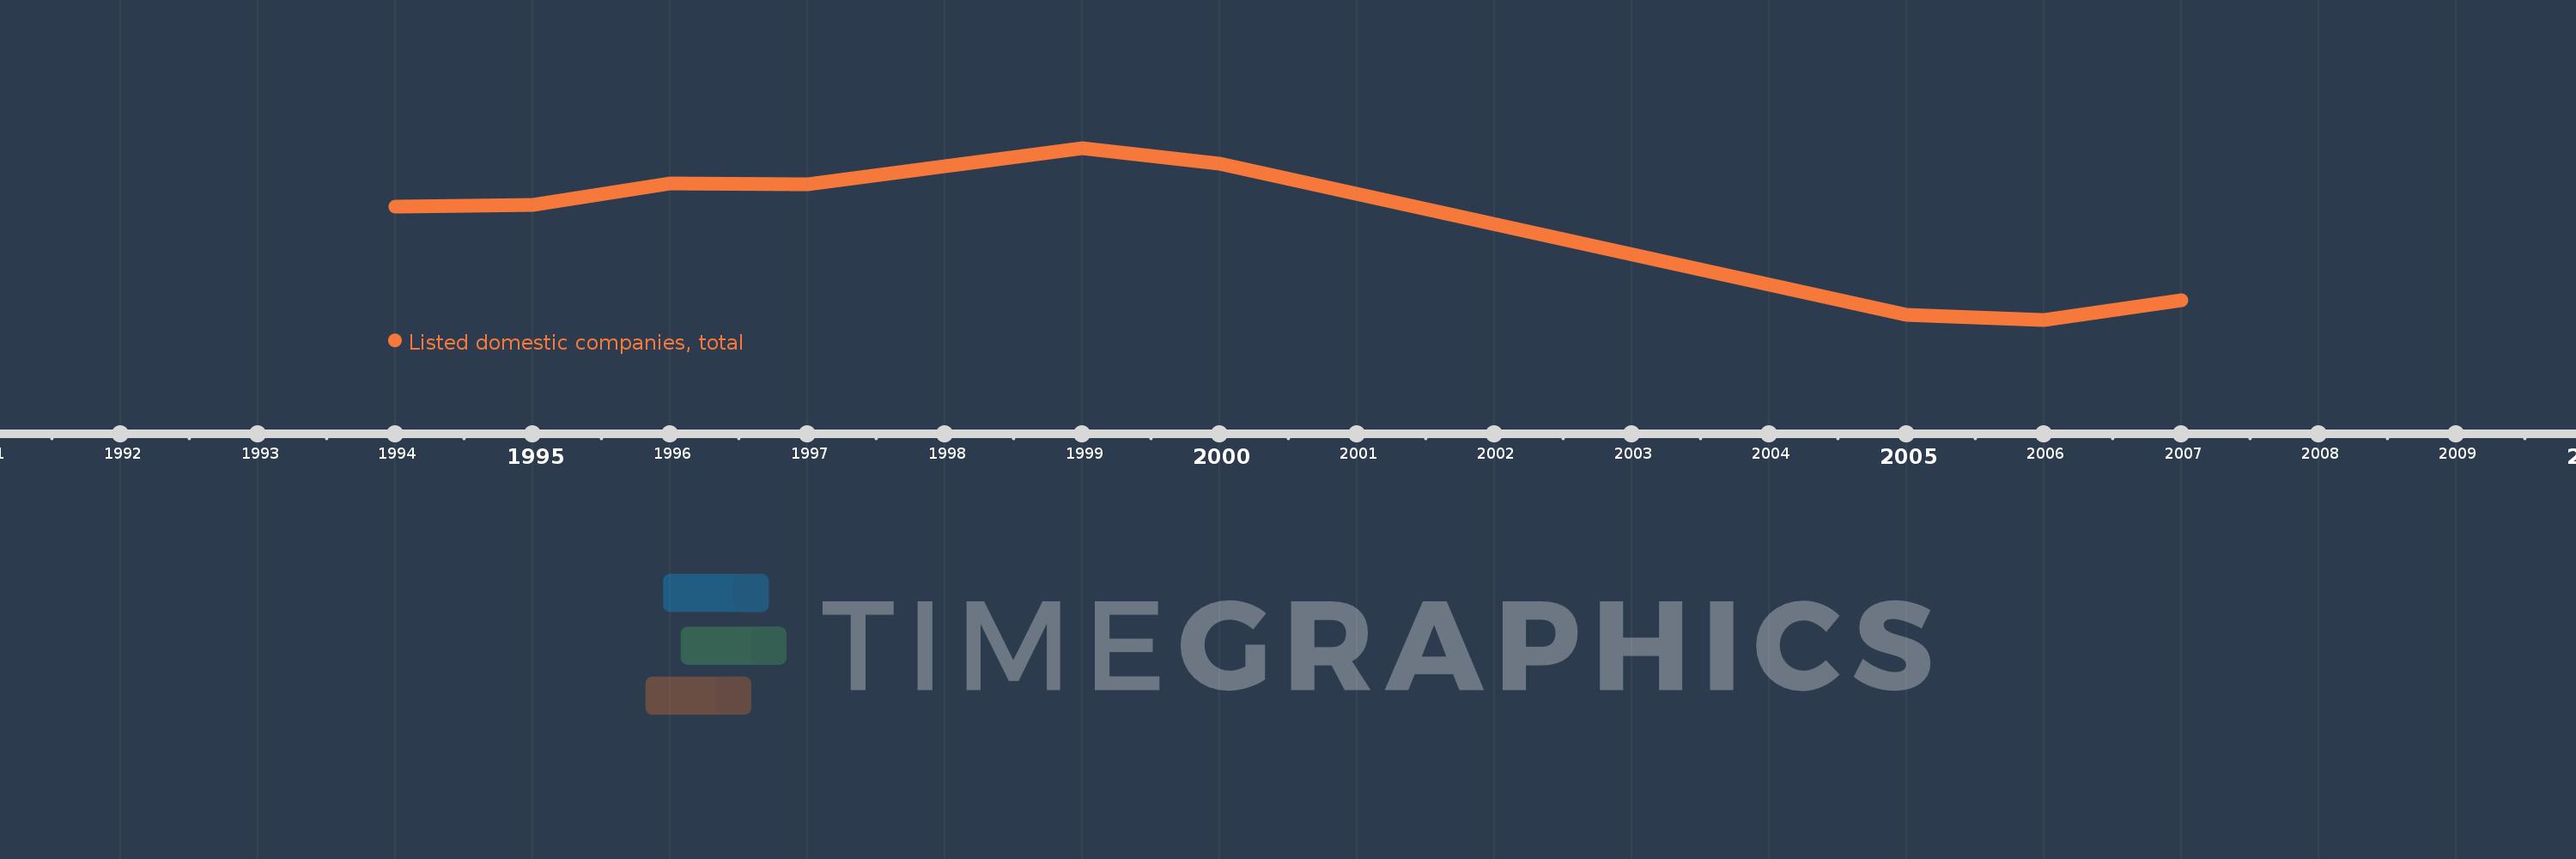
This timeline shows a graph from 1994 to 2007 of Sub-Saharan Africa (excluding high income). No data until 1993. Number of actual observations by date: 9.
Source name:
World Development Indicators
Source organization:
World Federation of Exchanges database.
Categories, topics:
Financial Sector
Last updated:
apr 23, 2017
Indicators value changes by year
Meaning:
936.889
Minimum:
748.0
jan 1, 2006
Maximum:
1.091K
jan 1, 1999
At the date of observation
Value
Absolute change
Change from the previous value
jan 1, 1994
974.0
+974.0
0.0%
jan 1, 1995
977.0
+3.0
0.31%
jan 1, 1996
1.02K
+43.0
4.4%
jan 1, 1997
1.018K
-2.0
-0.2%
jan 1, 1999
1.091K
+73.0
7.17%
jan 1, 2000
1.059K
-32.0
-2.93%
jan 1, 2005
758.0
-301.0
-28.42%
jan 1, 2006
748.0
-10.0
-1.32%
jan 1, 2007
787.0
+39.0
5.21%
Ranking of countries by current statistics by years