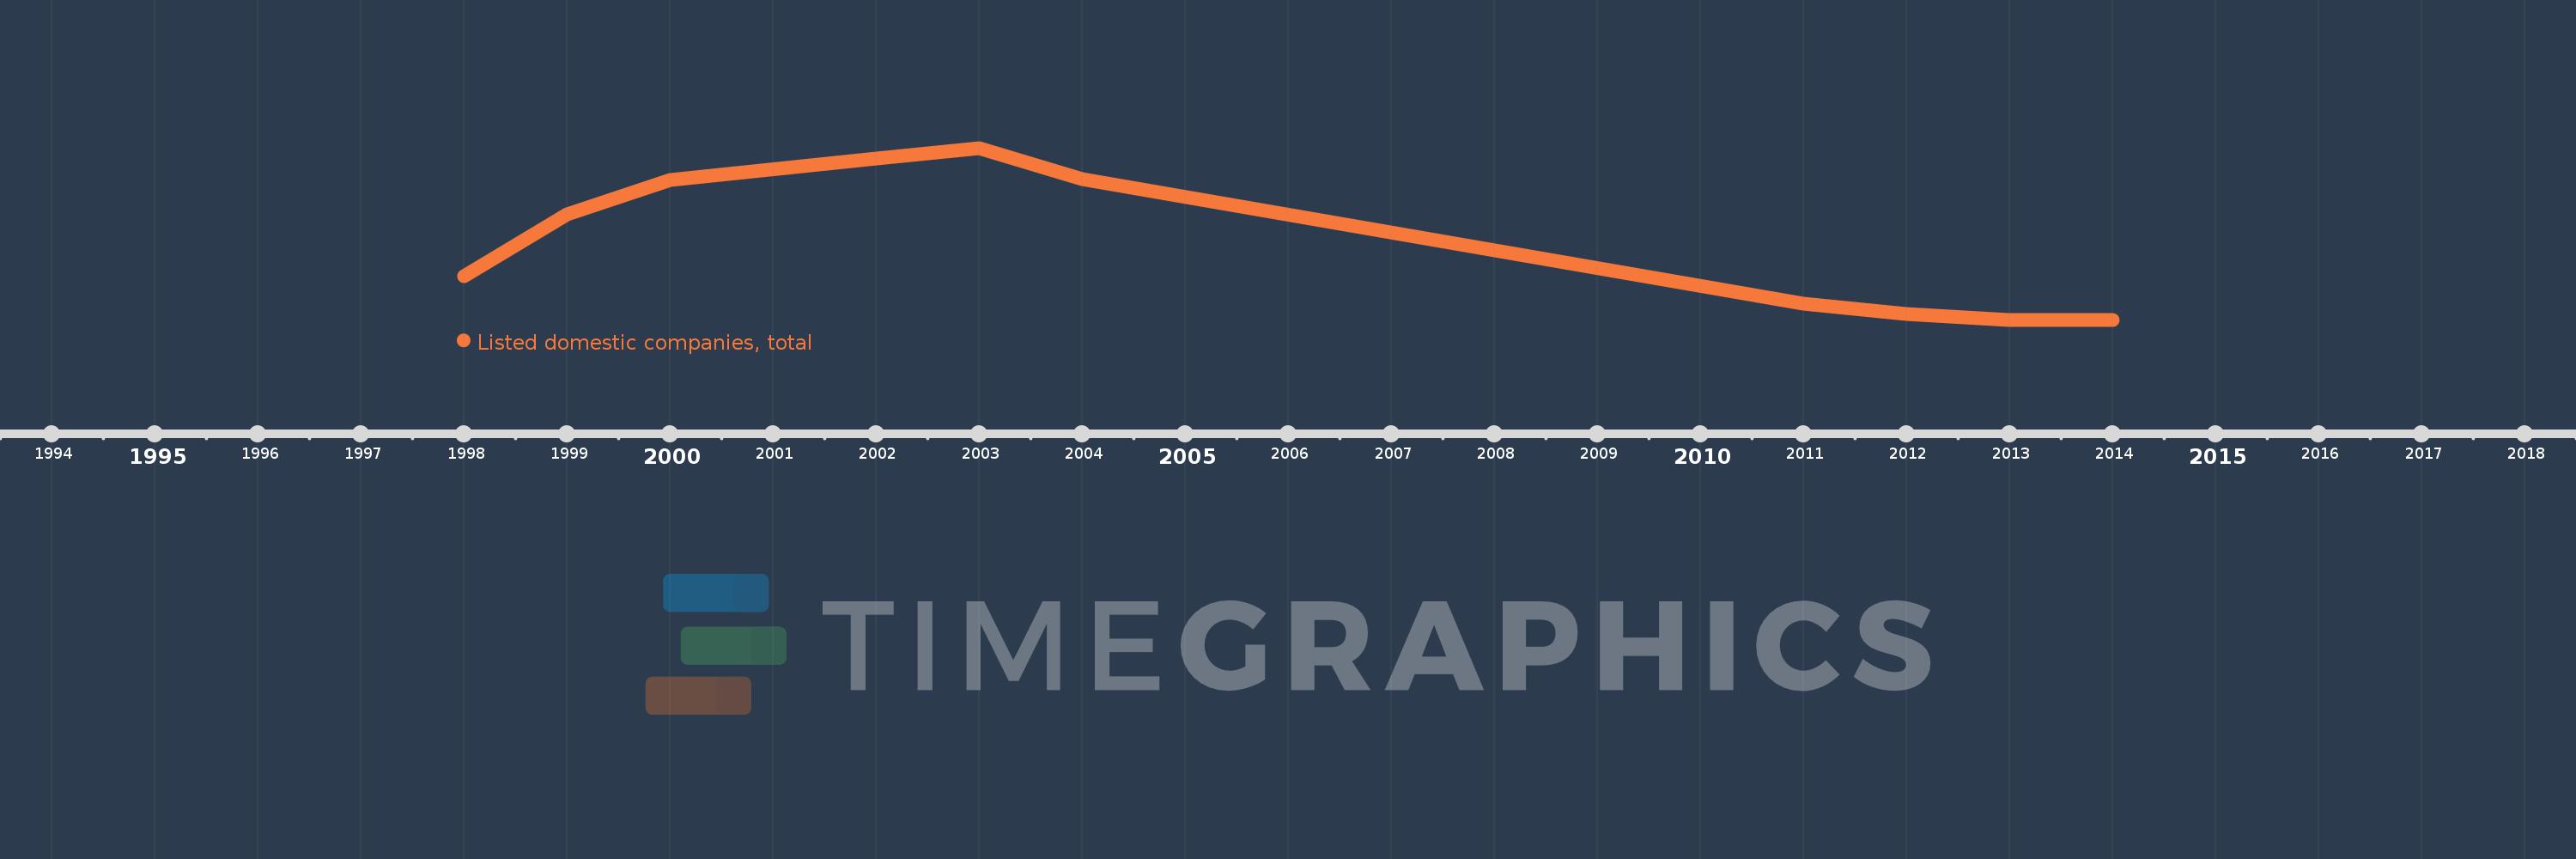
This timeline shows a graph from 1998 to 2014 of Middle East & North Africa (IDA & IBRD countries). No data until 1997. Number of actual observations by date: 10.
Source name:
World Development Indicators
Source organization:
World Federation of Exchanges database.
Categories, topics:
Financial Sector
Last updated:
apr 23, 2017
Indicators value changes by year
Meaning:
1.28K
Minimum:
944.0
jan 1, 2013
Maximum:
1.681K
jan 1, 2003
At the date of observation
Value
Absolute change
Change from the previous value
jan 1, 1998
1.132K
+1.132K
0.0%
jan 1, 1999
1.396K
+264.0
23.32%
jan 1, 2000
1.544K
+148.0
10.6%
jan 1, 2002
1.635K
+91.0
5.89%
jan 1, 2003
1.681K
+46.0
2.81%
jan 1, 2004
1.546K
-135.0
-8.03%
jan 1, 2011
1.012K
-534.0
-34.54%
jan 1, 2012
968.0
-44.0
-4.35%
jan 1, 2013
944.0
-24.0
-2.48%
jan 1, 2014
944.0
0.0
0.0%
Ranking of countries by current statistics by years