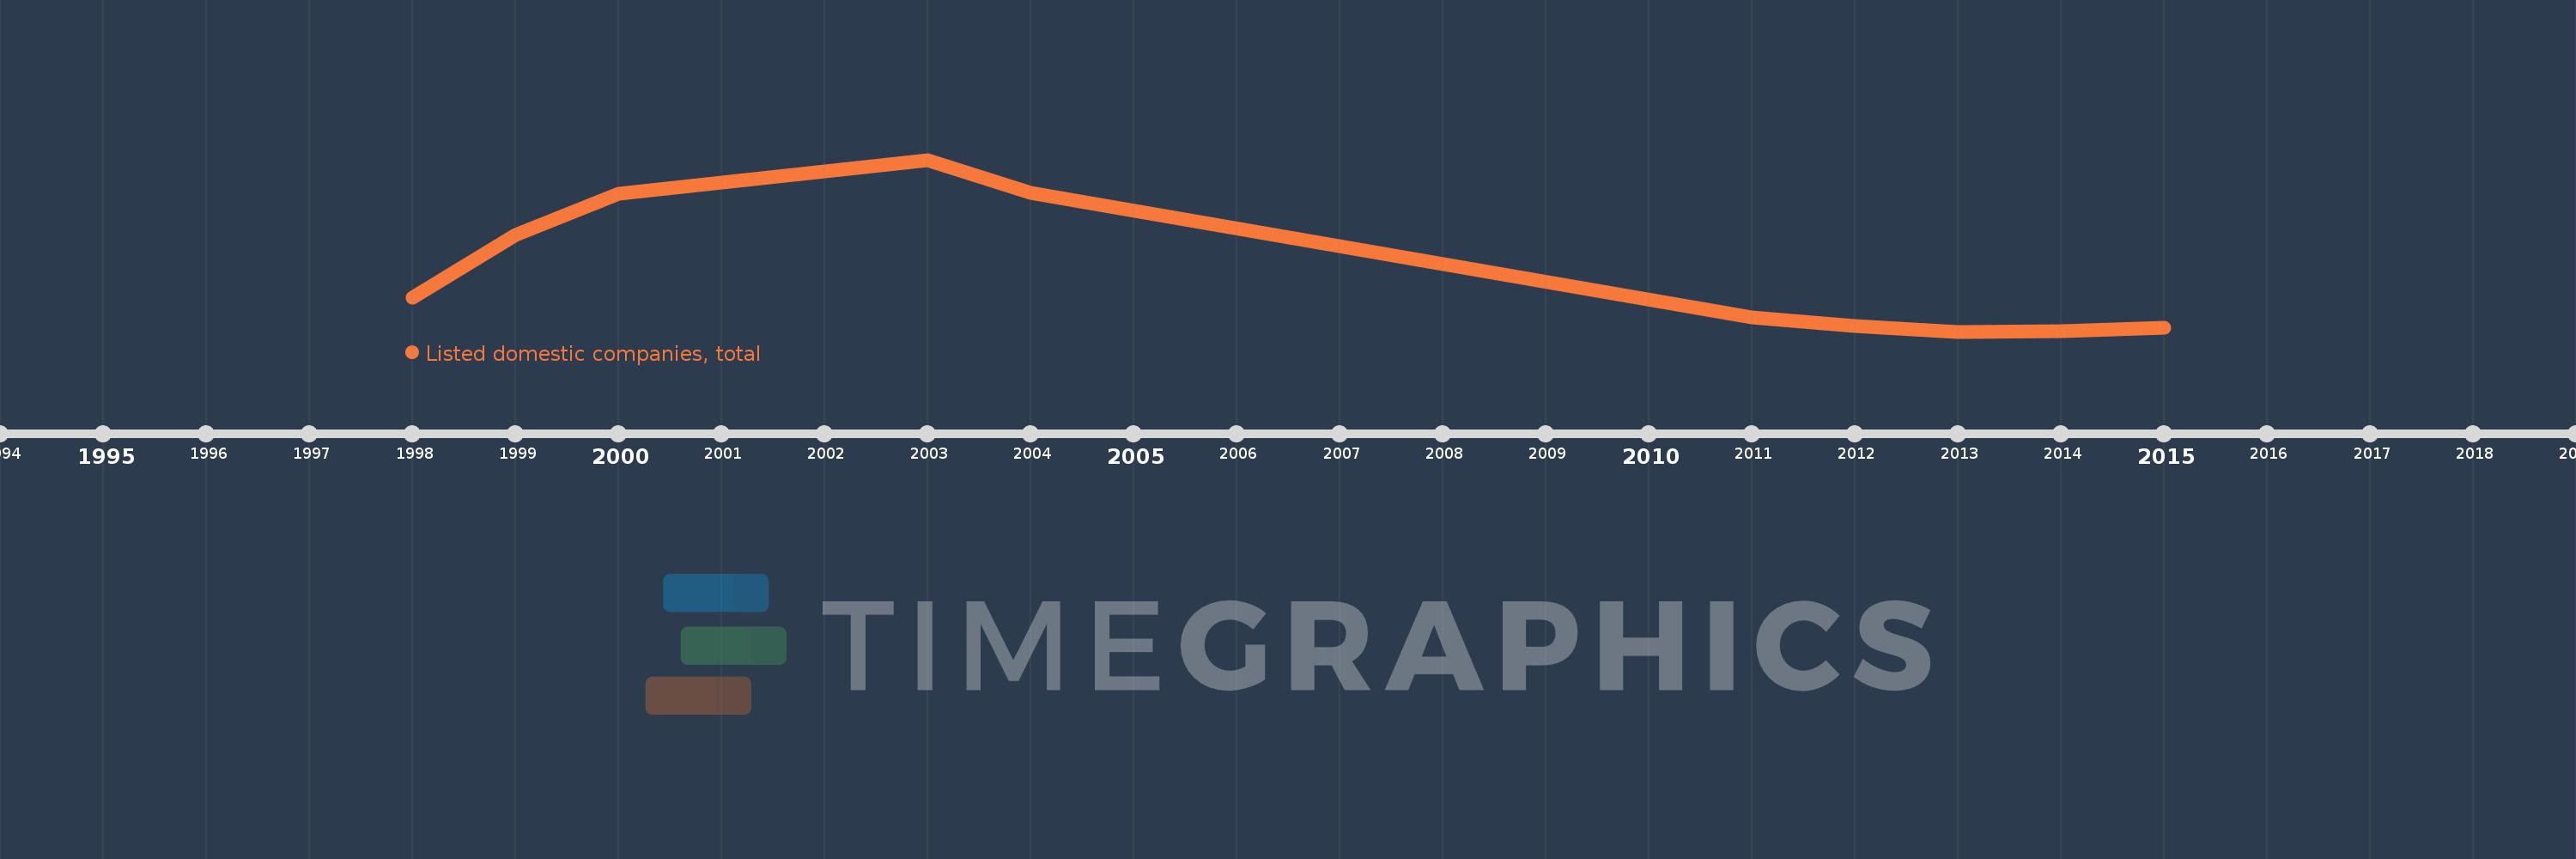
This timeline shows a graph from 1998 to 2015 of Middle East & North Africa (excluding high income). No data until 1997. Number of actual observations by date: 11.
Source name:
World Development Indicators
Source organization:
World Federation of Exchanges database.
Categories, topics:
Financial Sector
Last updated:
apr 23, 2017
Indicators value changes by year
Meaning:
1.281K
Minimum:
991.0
jan 1, 2013
Maximum:
1.709K
jan 1, 2003
At the date of observation
Value
Absolute change
Change from the previous value
jan 1, 1998
1.132K
+1.132K
0.0%
jan 1, 1999
1.396K
+264.0
23.32%
jan 1, 2000
1.568K
+172.0
12.32%
jan 1, 2002
1.66K
+92.0
5.87%
jan 1, 2003
1.709K
+49.0
2.95%
jan 1, 2004
1.572K
-137.0
-8.02%
jan 1, 2011
1.051K
-521.0
-33.14%
jan 1, 2012
1.013K
-38.0
-3.62%
jan 1, 2013
991.0
-22.0
-2.17%
jan 1, 2014
992.0
+1.0
0.1%
jan 1, 2015
1.006K
+14.0
1.41%
Ranking of countries by current statistics by years