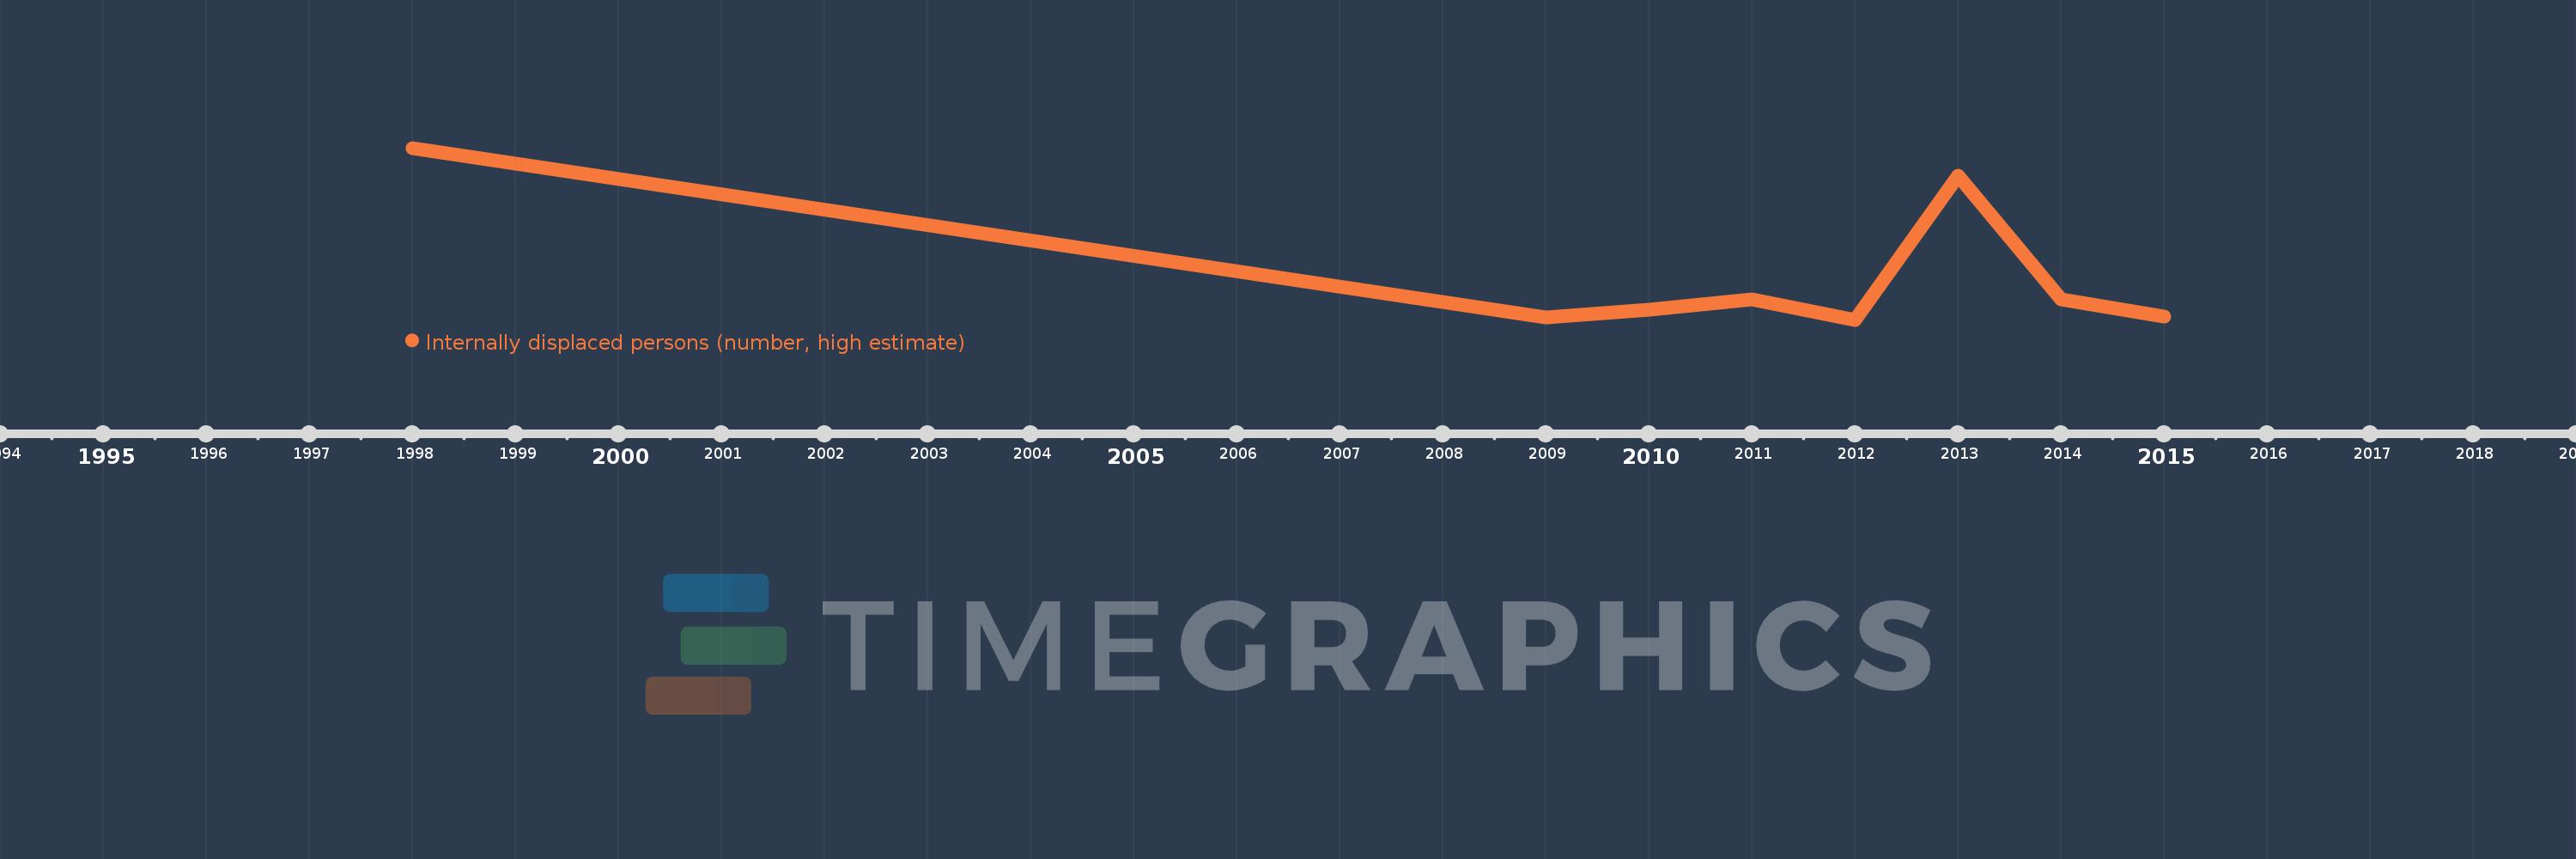
This timeline shows a graph from 1998 to 2015 of Sub-Saharan Africa (excluding high income). No data until 1997. Number of actual observations by date: 8.
Source name:
World Development Indicators
Source organization:
Internal Displacement Monitoring Centre.
Categories, topics:
Public Sector
Last updated:
apr 23, 2017
Indicators value changes by year
Meaning:
3.054 mln
Minimum:
611.121K
jan 1, 2012
Maximum:
9.623 mln
jan 1, 1998
At the date of observation
Value
Absolute change
Change from the previous value
jan 1, 1998
9.623 mln
+9.623 mln
0.0%
jan 1, 2009
754.373K
-8.869 mln
-92.16%
jan 1, 2010
1.125 mln
+370.32K
49.09%
jan 1, 2011
1.7 mln
+575.656K
51.18%
jan 1, 2012
611.121K
-1.089 mln
-64.06%
jan 1, 2013
8.166 mln
+7.555 mln
1.24K%
jan 1, 2014
1.691 mln
-6.475 mln
-79.29%
jan 1, 2015
763.351K
-927.747K
-54.86%
Ranking of countries by current statistics by years