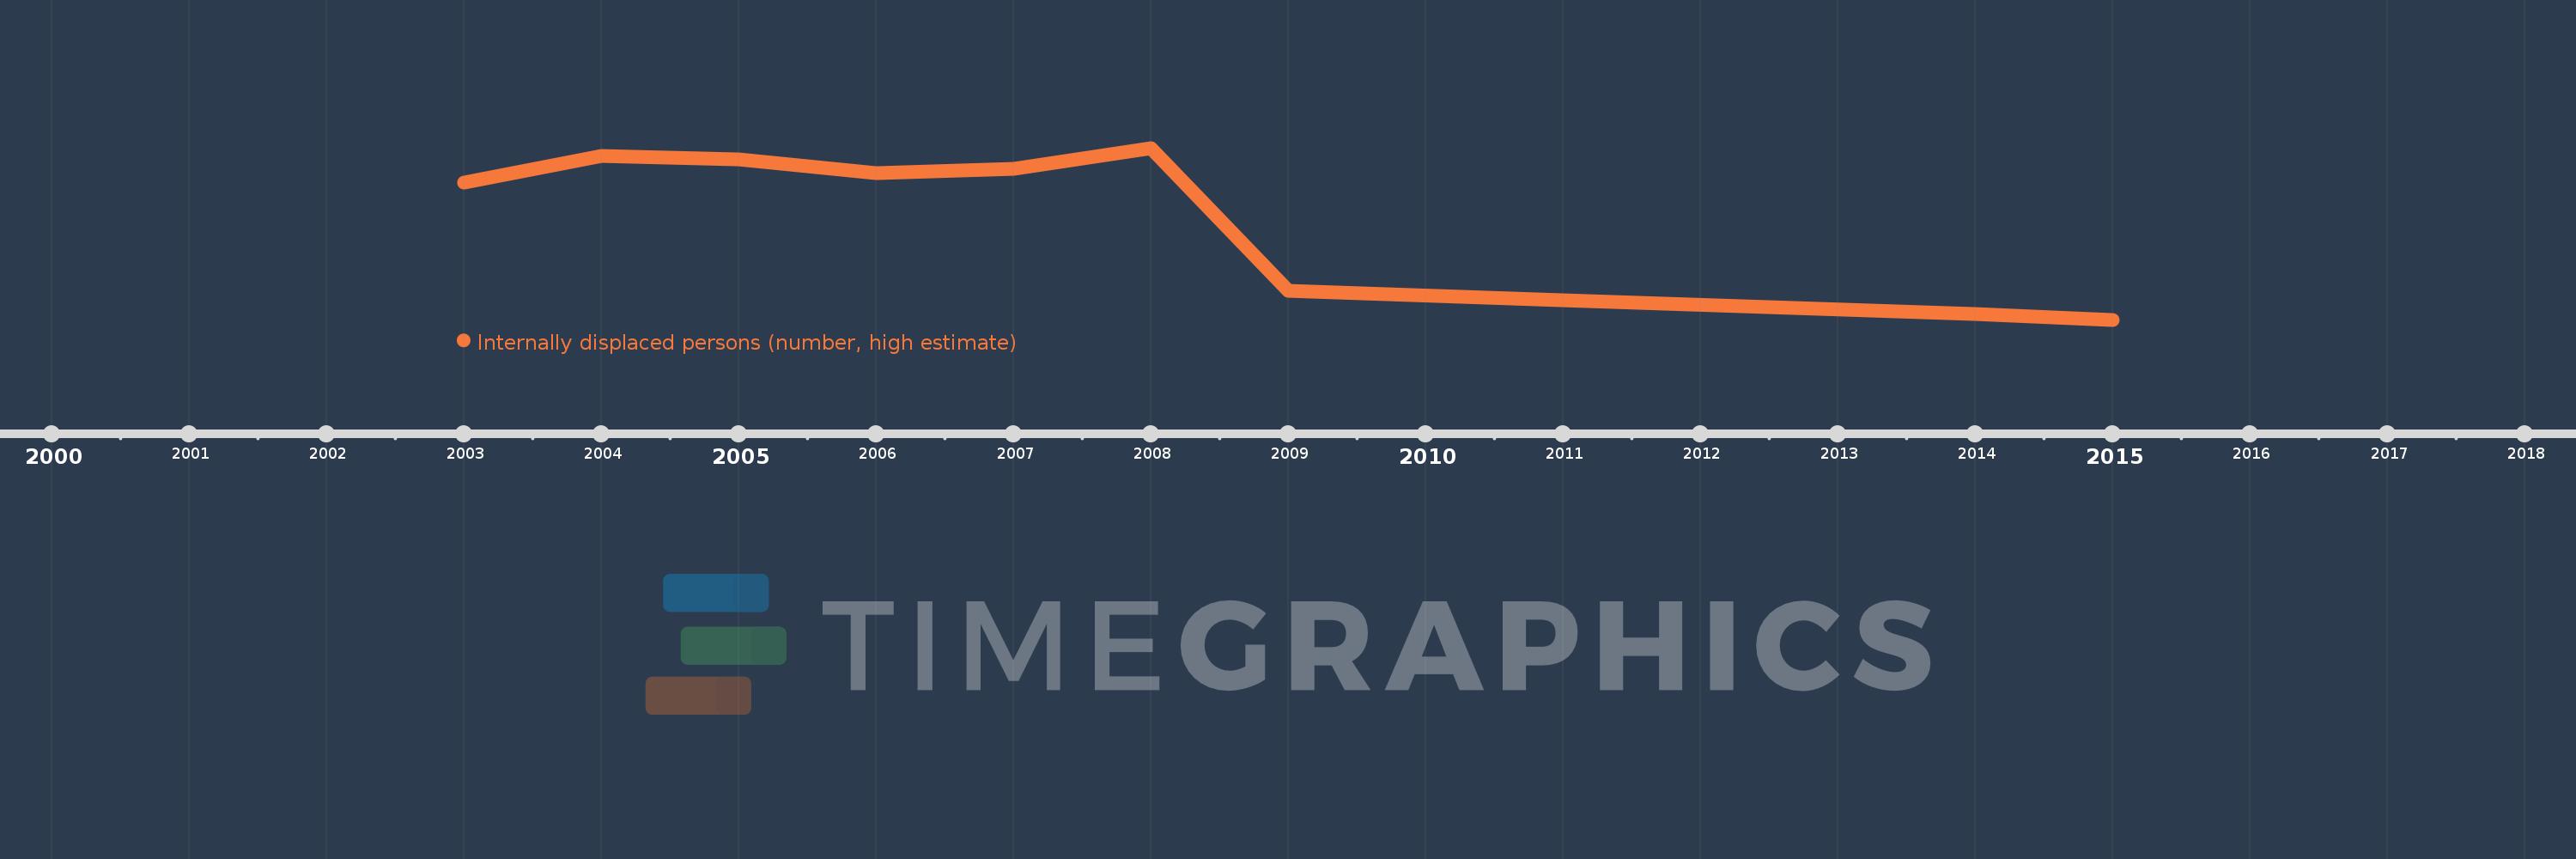
This timeline shows a graph from 2003 to 2015 of Fragile and conflict affected situations. No data until 2002. Number of actual observations by date: 10.
Source name:
World Development Indicators
Source organization:
Internal Displacement Monitoring Centre.
Categories, topics:
Public Sector
Last updated:
apr 23, 2017
Indicators value changes by year
Meaning:
8.053 mln
Minimum:
607.615K
jan 1, 2015
Maximum:
13.6 mln
jan 1, 2008
At the date of observation
Value
Absolute change
Change from the previous value
jan 1, 2003
11.005 mln
+11.005 mln
0.0%
jan 1, 2004
13.001 mln
+1.995 mln
18.13%
jan 1, 2005
12.74 mln
-260.7K
-2.01%
jan 1, 2006
11.699 mln
-1.041 mln
-8.17%
jan 1, 2007
11.993 mln
+294.306K
2.52%
jan 1, 2008
13.6 mln
+1.606 mln
13.39%
jan 1, 2009
2.782 mln
-10.818 mln
-79.54%
jan 1, 2011
2.075 mln
-707.095K
-25.42%
jan 1, 2014
1.025 mln
-1.05 mln
-50.61%
jan 1, 2015
607.615K
-417.025K
-40.7%
Ranking of countries by current statistics by years