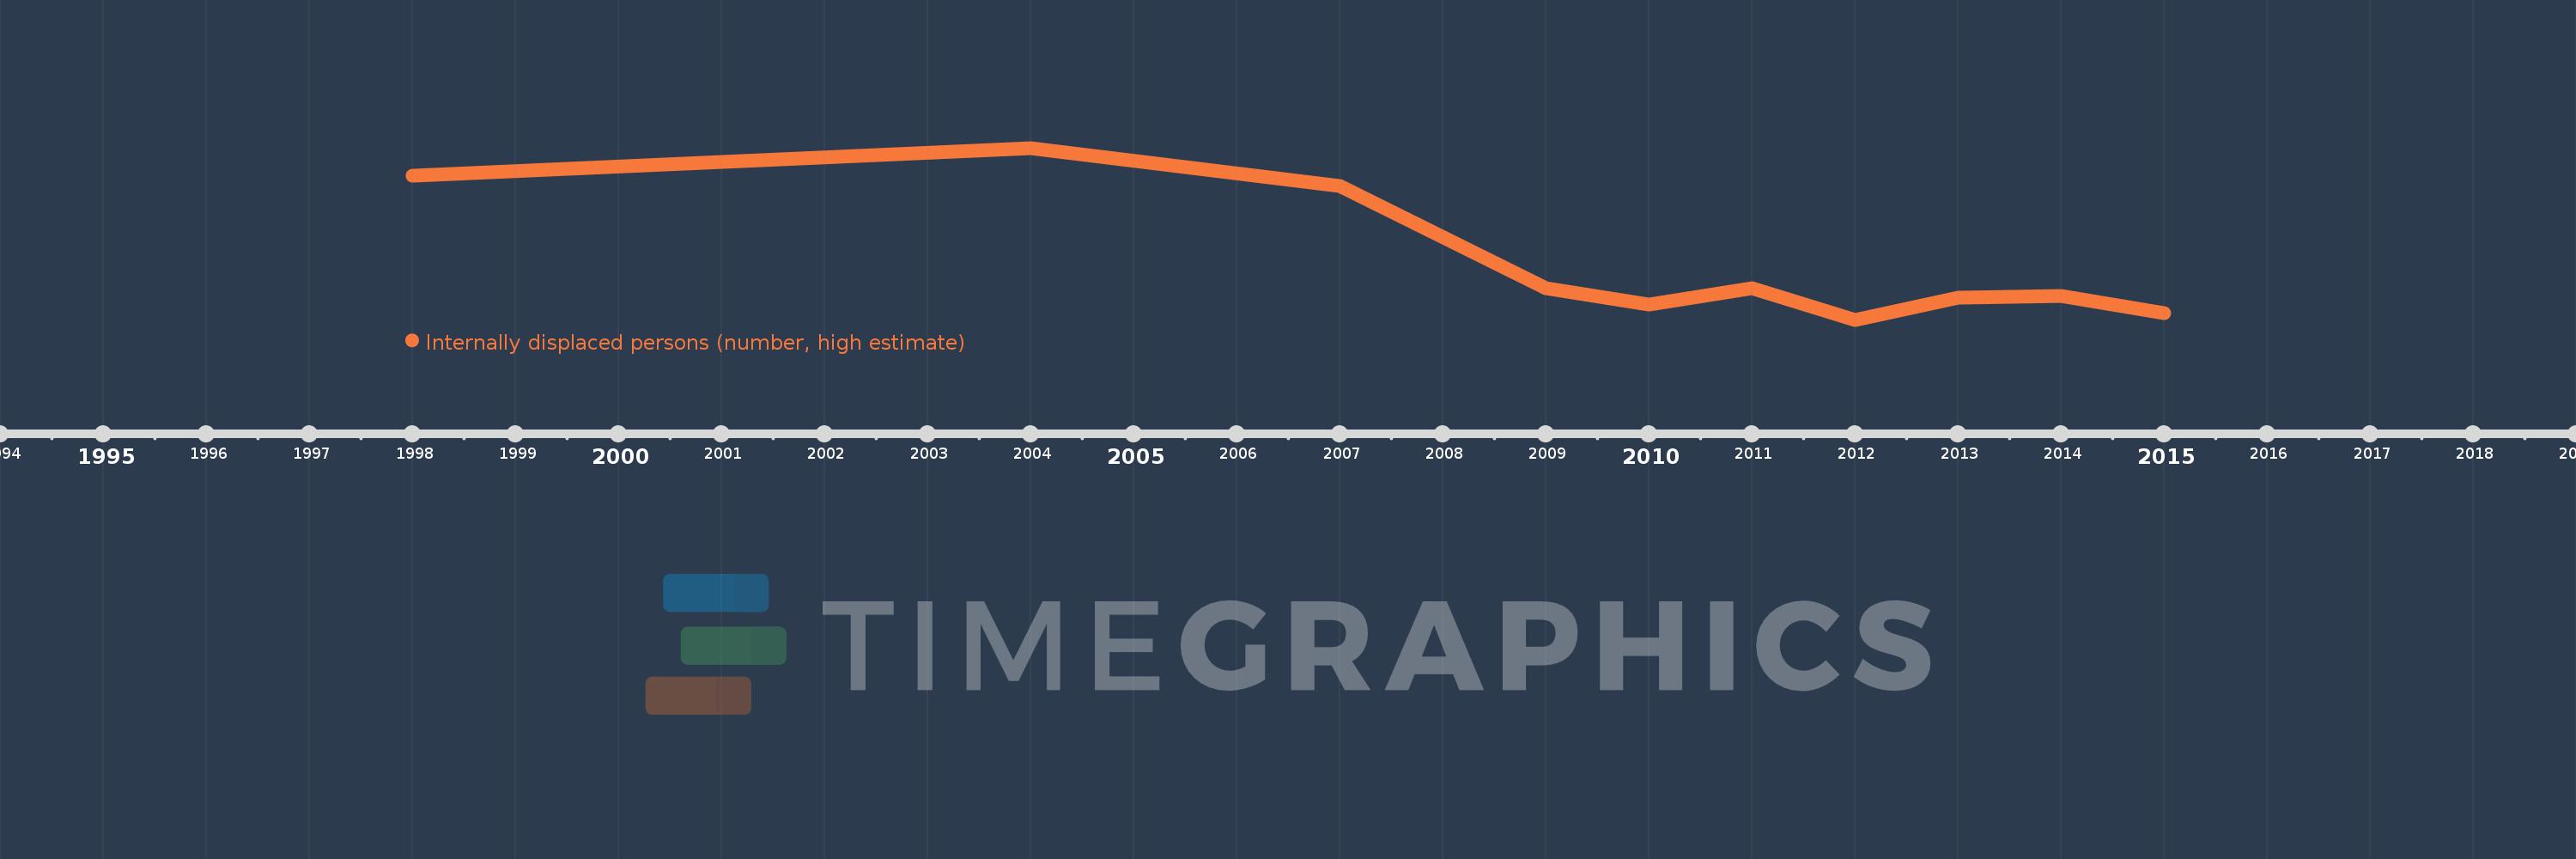
This timeline shows a graph from 1998 to 2015 of Least developed countries: UN classification. No data until 1997. Number of actual observations by date: 10.
Source name:
World Development Indicators
Source organization:
Internal Displacement Monitoring Centre.
Categories, topics:
Public Sector
Last updated:
apr 23, 2017
Indicators value changes by year
Meaning:
5.31 mln
Minimum:
1.164 mln
jan 1, 2012
Maximum:
13.422 mln
jan 1, 2004
At the date of observation
Value
Absolute change
Change from the previous value
jan 1, 1998
11.45 mln
+11.45 mln
0.0%
jan 1, 2004
13.422 mln
+1.972 mln
17.22%
jan 1, 2007
10.736 mln
-2.685 mln
-20.01%
jan 1, 2009
3.443 mln
-7.293 mln
-67.93%
jan 1, 2010
2.252 mln
-1.192 mln
-34.61%
jan 1, 2011
3.418 mln
+1.166 mln
51.79%
jan 1, 2012
1.164 mln
-2.253 mln
-65.93%
jan 1, 2013
2.757 mln
+1.593 mln
136.79%
jan 1, 2014
2.846 mln
+88.987K
3.23%
jan 1, 2015
1.614 mln
-1.232 mln
-43.29%
Ranking of countries by current statistics by years