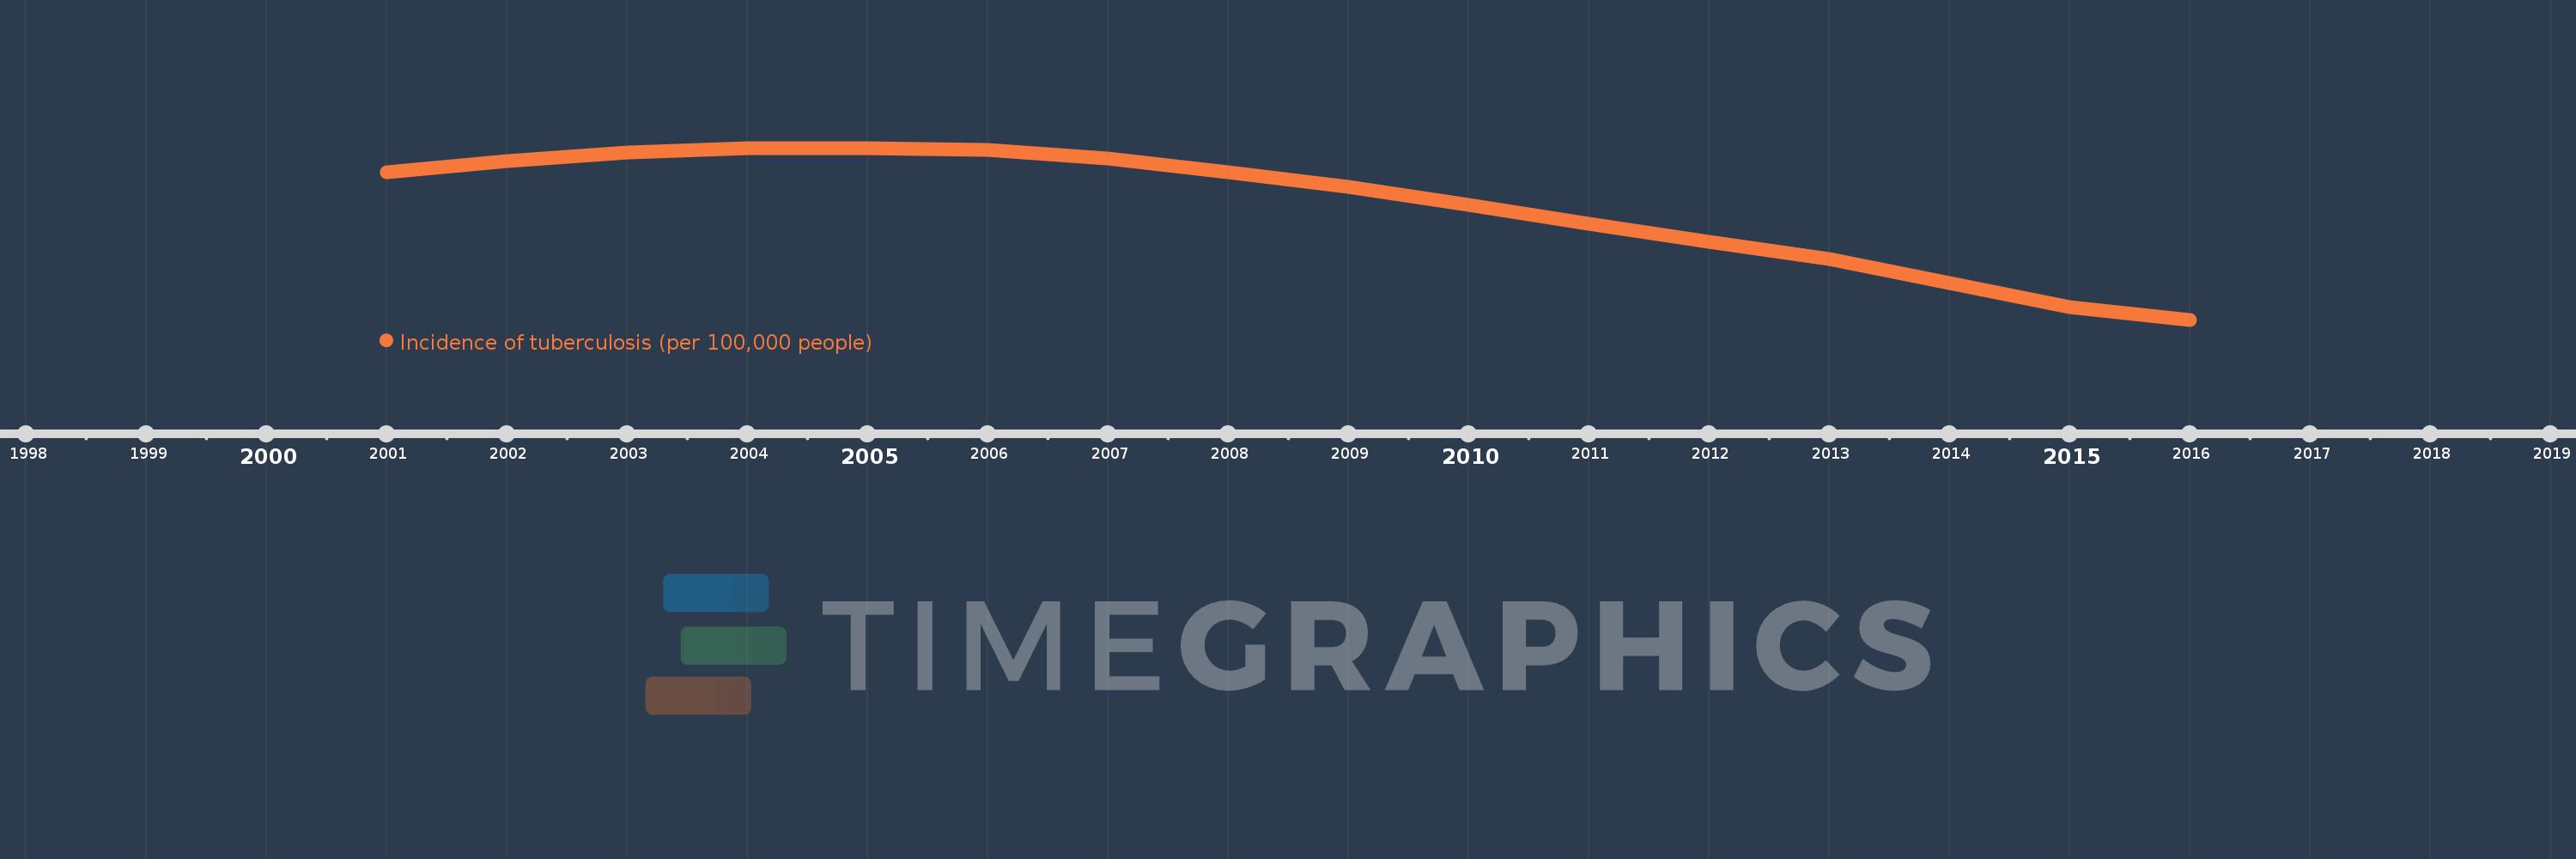
This timeline shows a graph from 2001 to 2016 of Sub-Saharan Africa (excluding high income). No data until 2000. Number of actual observations by date: 16.
Source name:
World Development Indicators
Source organization:
World Health Organization, Global Tuberculosis Report.
Categories, topics:
Health, Aid Effectiveness
Last updated:
apr 23, 2017
Indicators value changes by year
Meaning:
328.563
Minimum:
276.0
jan 1, 2016
Maximum:
355.0
jan 1, 2004
At the date of observation
Value
Absolute change
Change from the previous value
jan 1, 2001
344.0
+344.0
0.0%
jan 1, 2002
349.0
+5.0
1.45%
jan 1, 2003
353.0
+4.0
1.15%
jan 1, 2004
355.0
+2.0
0.57%
jan 1, 2005
355.0
0.0
0.0%
jan 1, 2006
354.0
-1.0
-0.28%
jan 1, 2007
350.0
-4.0
-1.13%
jan 1, 2008
344.0
-6.0
-1.71%
jan 1, 2009
337.0
-7.0
-2.03%
jan 1, 2010
329.0
-8.0
-2.37%
jan 1, 2011
320.0
-9.0
-2.74%
jan 1, 2012
312.0
-8.0
-2.5%
jan 1, 2013
304.0
-8.0
-2.56%
jan 1, 2014
293.0
-11.0
-3.62%
jan 1, 2015
282.0
-11.0
-3.75%
jan 1, 2016
276.0
-6.0
-2.13%
Ranking of countries by current statistics by years