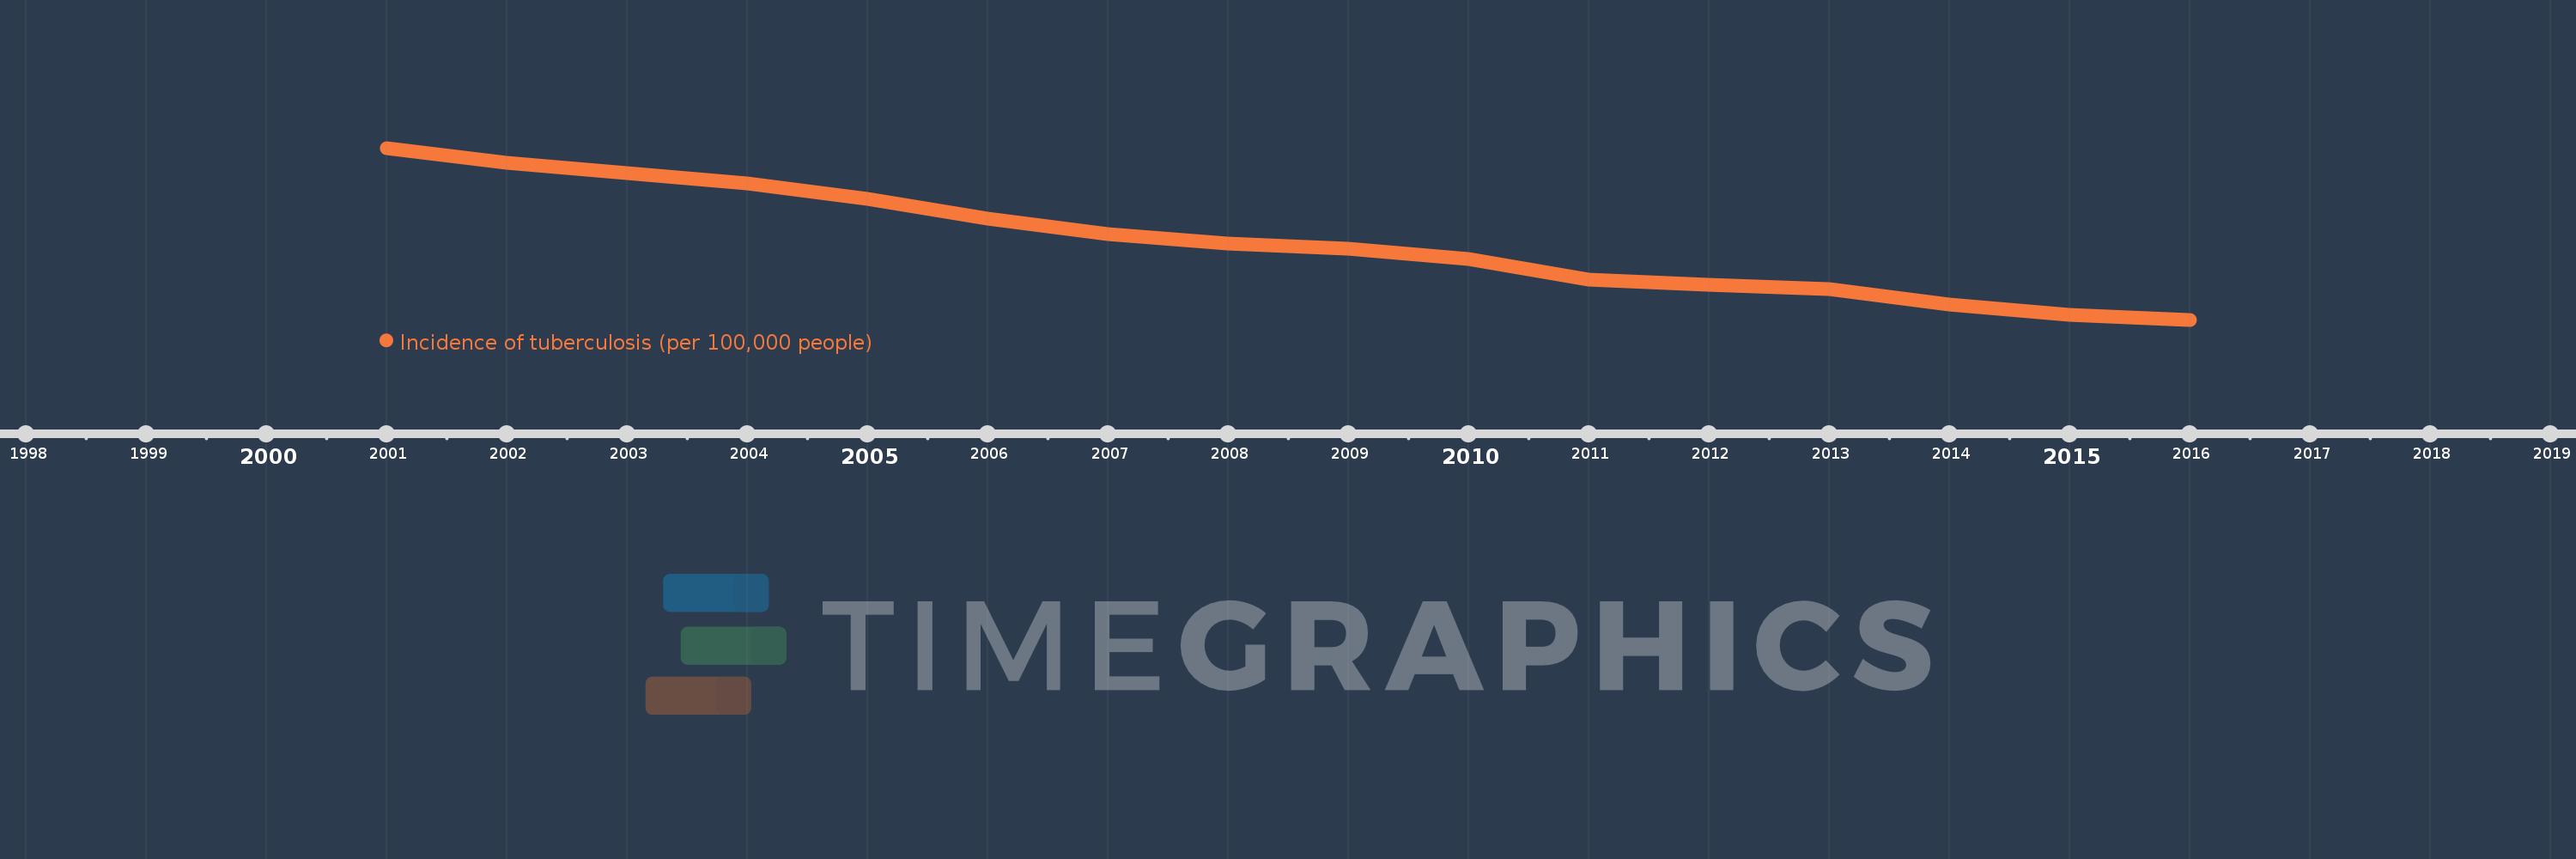
This timeline shows a graph from 2001 to 2016 of East Asia & Pacific (excluding high income). No data until 2000. Number of actual observations by date: 16.
Source name:
World Development Indicators
Source organization:
World Health Organization, Global Tuberculosis Report.
Categories, topics:
Health, Aid Effectiveness
Last updated:
apr 23, 2017
Indicators value changes by year
Meaning:
162.5
Minimum:
147.0
jan 1, 2016
Maximum:
181.0
jan 1, 2001
At the date of observation
Value
Absolute change
Change from the previous value
jan 1, 2001
181.0
+181.0
0.0%
jan 1, 2002
178.0
-3.0
-1.66%
jan 1, 2003
176.0
-2.0
-1.12%
jan 1, 2004
174.0
-2.0
-1.14%
jan 1, 2005
171.0
-3.0
-1.72%
jan 1, 2006
167.0
-4.0
-2.34%
jan 1, 2007
164.0
-3.0
-1.8%
jan 1, 2008
162.0
-2.0
-1.22%
jan 1, 2009
161.0
-1.0
-0.62%
jan 1, 2010
159.0
-2.0
-1.24%
jan 1, 2011
155.0
-4.0
-2.52%
jan 1, 2012
154.0
-1.0
-0.65%
jan 1, 2013
153.0
-1.0
-0.65%
jan 1, 2014
150.0
-3.0
-1.96%
jan 1, 2015
148.0
-2.0
-1.33%
jan 1, 2016
147.0
-1.0
-0.68%
Ranking of countries by current statistics by years