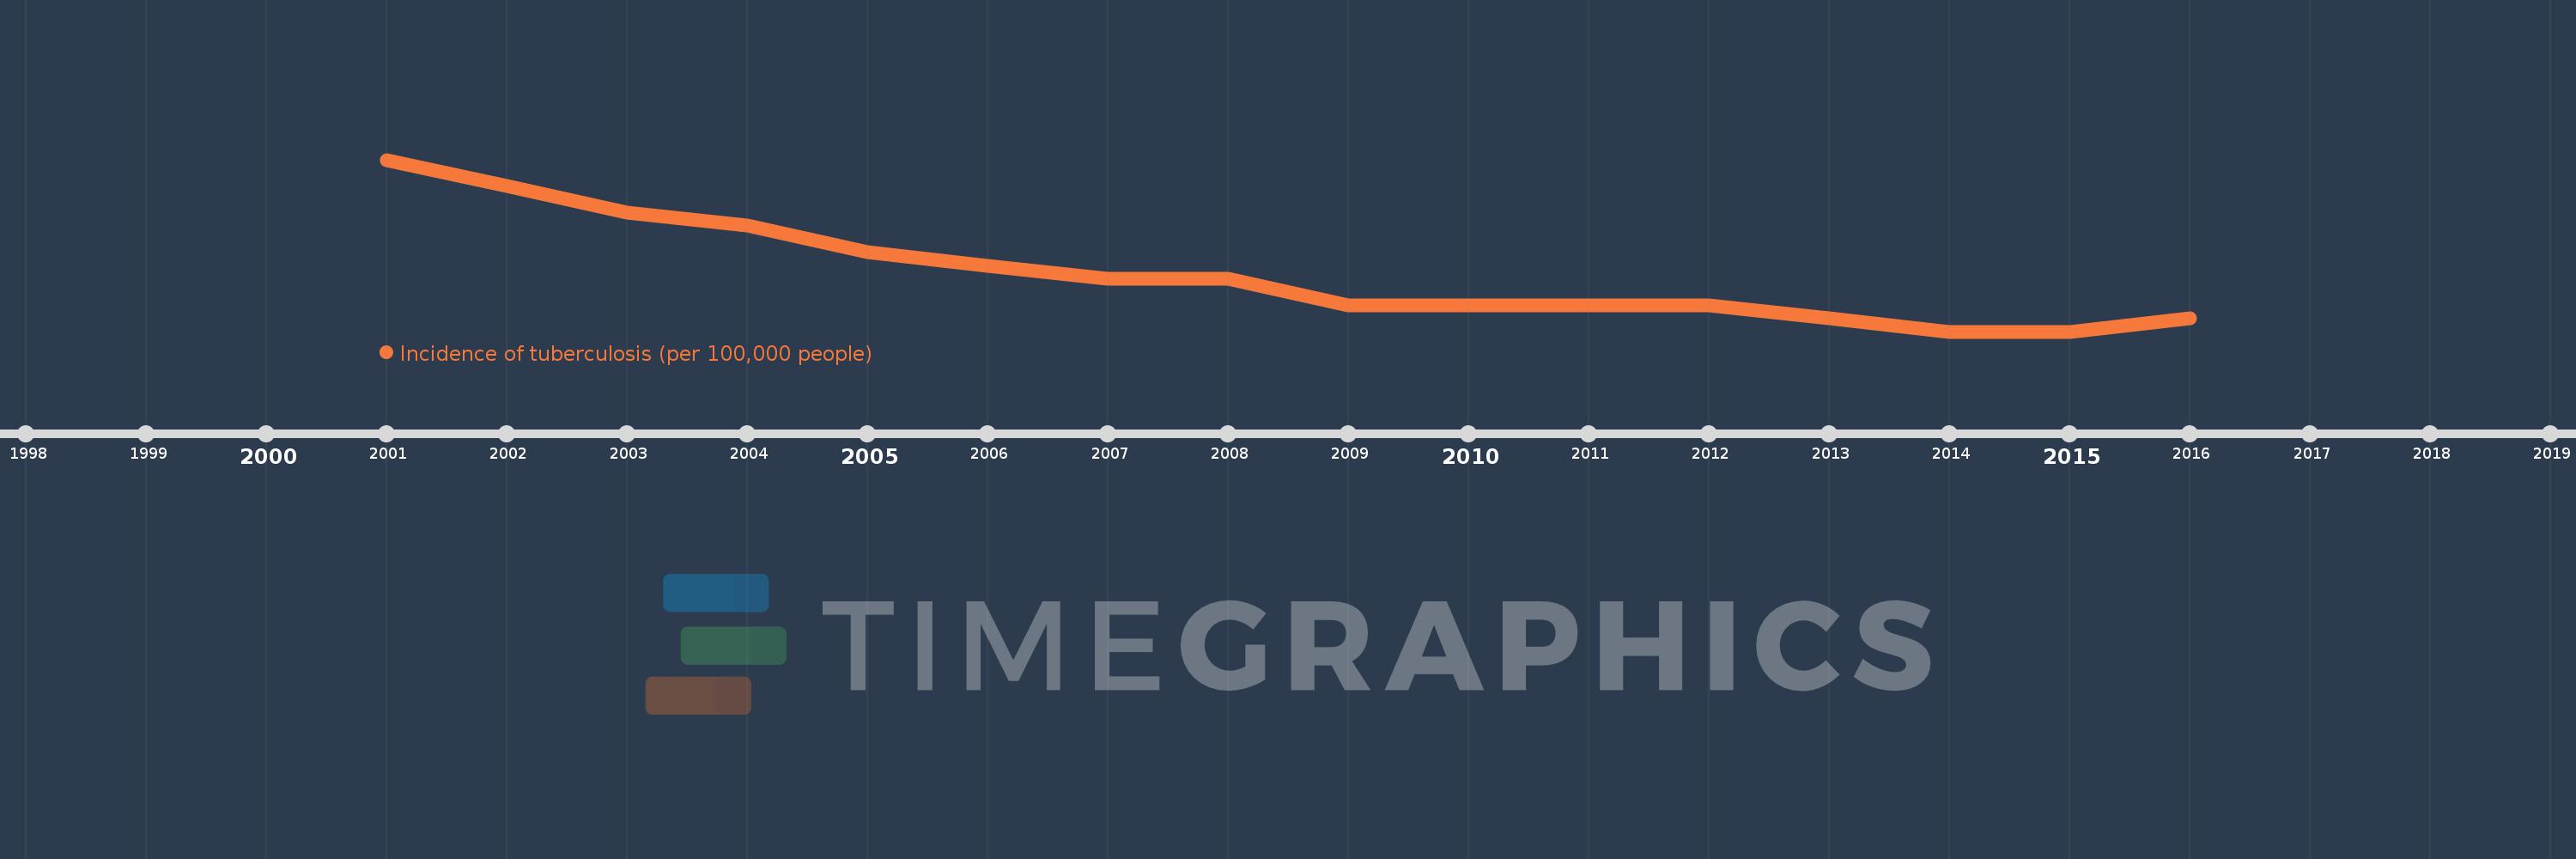
This timeline shows a graph from 2001 to 2016 of Middle East & North Africa (excluding high income). No data until 2000. Number of actual observations by date: 16.
Source name:
World Development Indicators
Source organization:
World Health Organization, Global Tuberculosis Report.
Categories, topics:
Health, Aid Effectiveness
Last updated:
apr 23, 2017
Indicators value changes by year
Meaning:
41.375
Minimum:
37.0
jan 1, 2014
Maximum:
50.0
jan 1, 2001
At the date of observation
Value
Absolute change
Change from the previous value
jan 1, 2001
50.0
+50.0
0.0%
jan 1, 2002
48.0
-2.0
-4.0%
jan 1, 2003
46.0
-2.0
-4.17%
jan 1, 2004
45.0
-1.0
-2.17%
jan 1, 2005
43.0
-2.0
-4.44%
jan 1, 2006
42.0
-1.0
-2.33%
jan 1, 2007
41.0
-1.0
-2.38%
jan 1, 2008
41.0
0.0
0.0%
jan 1, 2009
39.0
-2.0
-4.88%
jan 1, 2010
39.0
0.0
0.0%
jan 1, 2011
39.0
0.0
0.0%
jan 1, 2012
39.0
0.0
0.0%
jan 1, 2013
38.0
-1.0
-2.56%
jan 1, 2014
37.0
-1.0
-2.63%
jan 1, 2015
37.0
0.0
0.0%
jan 1, 2016
38.0
+1.0
2.7%
Ranking of countries by current statistics by years