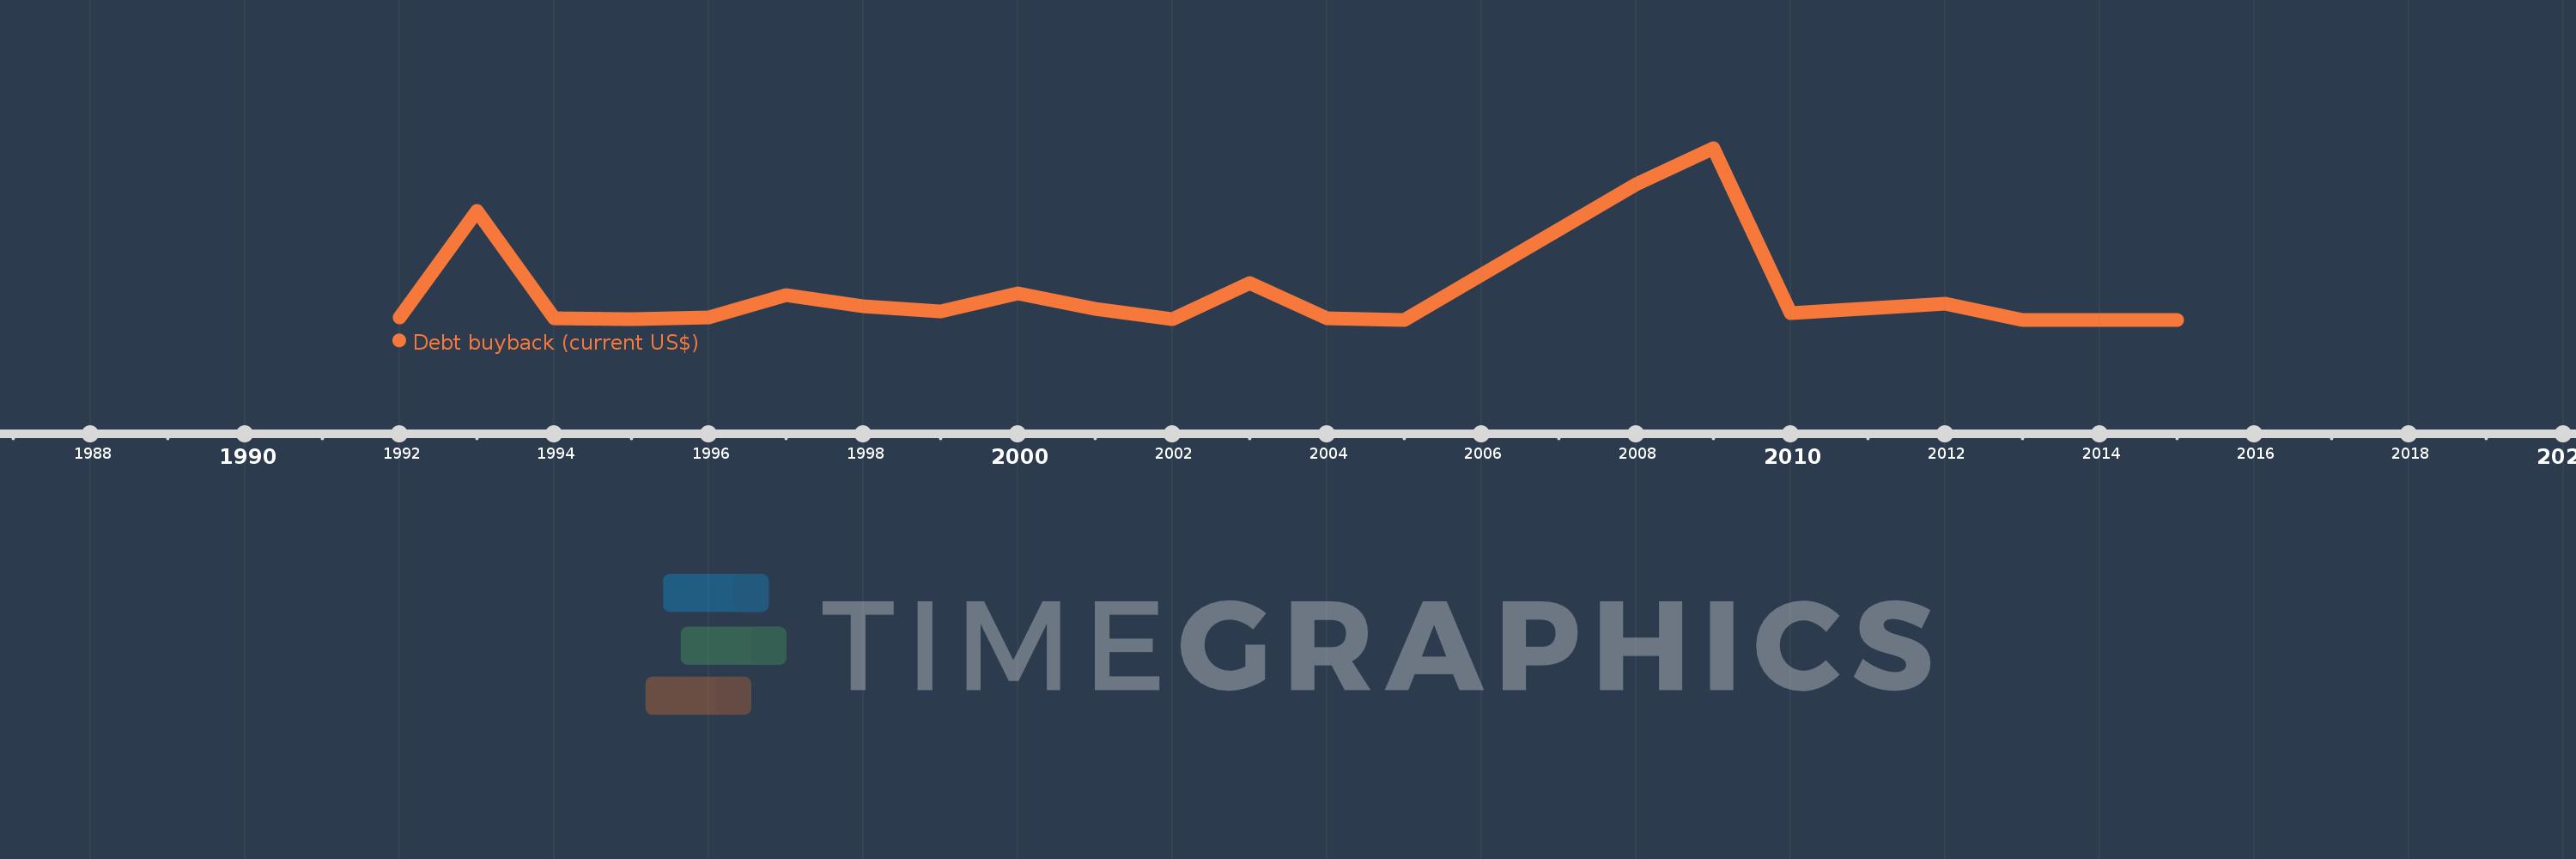
This timeline shows a graph from 1992 to 2015 of Sub-Saharan Africa (excluding high income). No data until 1991. Number of actual observations by date: 20.
Source name:
World Development Indicators
Source organization:
World Bank, International Debt Statistics.
Categories, topics:
External Debt
Last updated:
apr 23, 2017
Indicators value changes by year
Meaning:
348.887 mln
Minimum:
0.0
jan 1, 2005
Maximum:
2.11 bln
jan 1, 2009
At the date of observation
Value
Absolute change
Change from the previous value
jan 1, 1992
30.492 mln
+30.492 mln
0.0%
jan 1, 1993
1.334 bln
+1.304 bln
4.28K%
jan 1, 1994
17.324 mln
-1.317 bln
-98.7%
jan 1, 1995
7.705 mln
-9.619 mln
-55.52%
jan 1, 1996
29.431 mln
+21.726 mln
281.97%
jan 1, 1997
301.488 mln
+272.057 mln
924.39%
jan 1, 1998
169.065 mln
-132.423 mln
-43.92%
jan 1, 1999
101.68 mln
-67.385 mln
-39.86%
jan 1, 2000
325.128 mln
+223.448 mln
219.76%
jan 1, 2001
136.904 mln
-188.224 mln
-57.89%
jan 1, 2002
7.42 mln
-129.484 mln
-94.58%
jan 1, 2003
452.0 mln
+444.58 mln
5.99K%
jan 1, 2004
19.735 mln
-432.265 mln
-95.63%
jan 1, 2005
0.0
-19.735 mln
-100.0%
jan 1, 2008
1.659 bln
+1.659 bln
%
jan 1, 2009
2.11 bln
+451.017 mln
27.19%
jan 1, 2010
76.442 mln
-2.033 bln
-96.38%
jan 1, 2012
200.0 mln
+123.558 mln
161.64%
jan 1, 2013
0.0
-200.0 mln
-100.0%
jan 1, 2015
0.0
0.0
%
Ranking of countries by current statistics by years