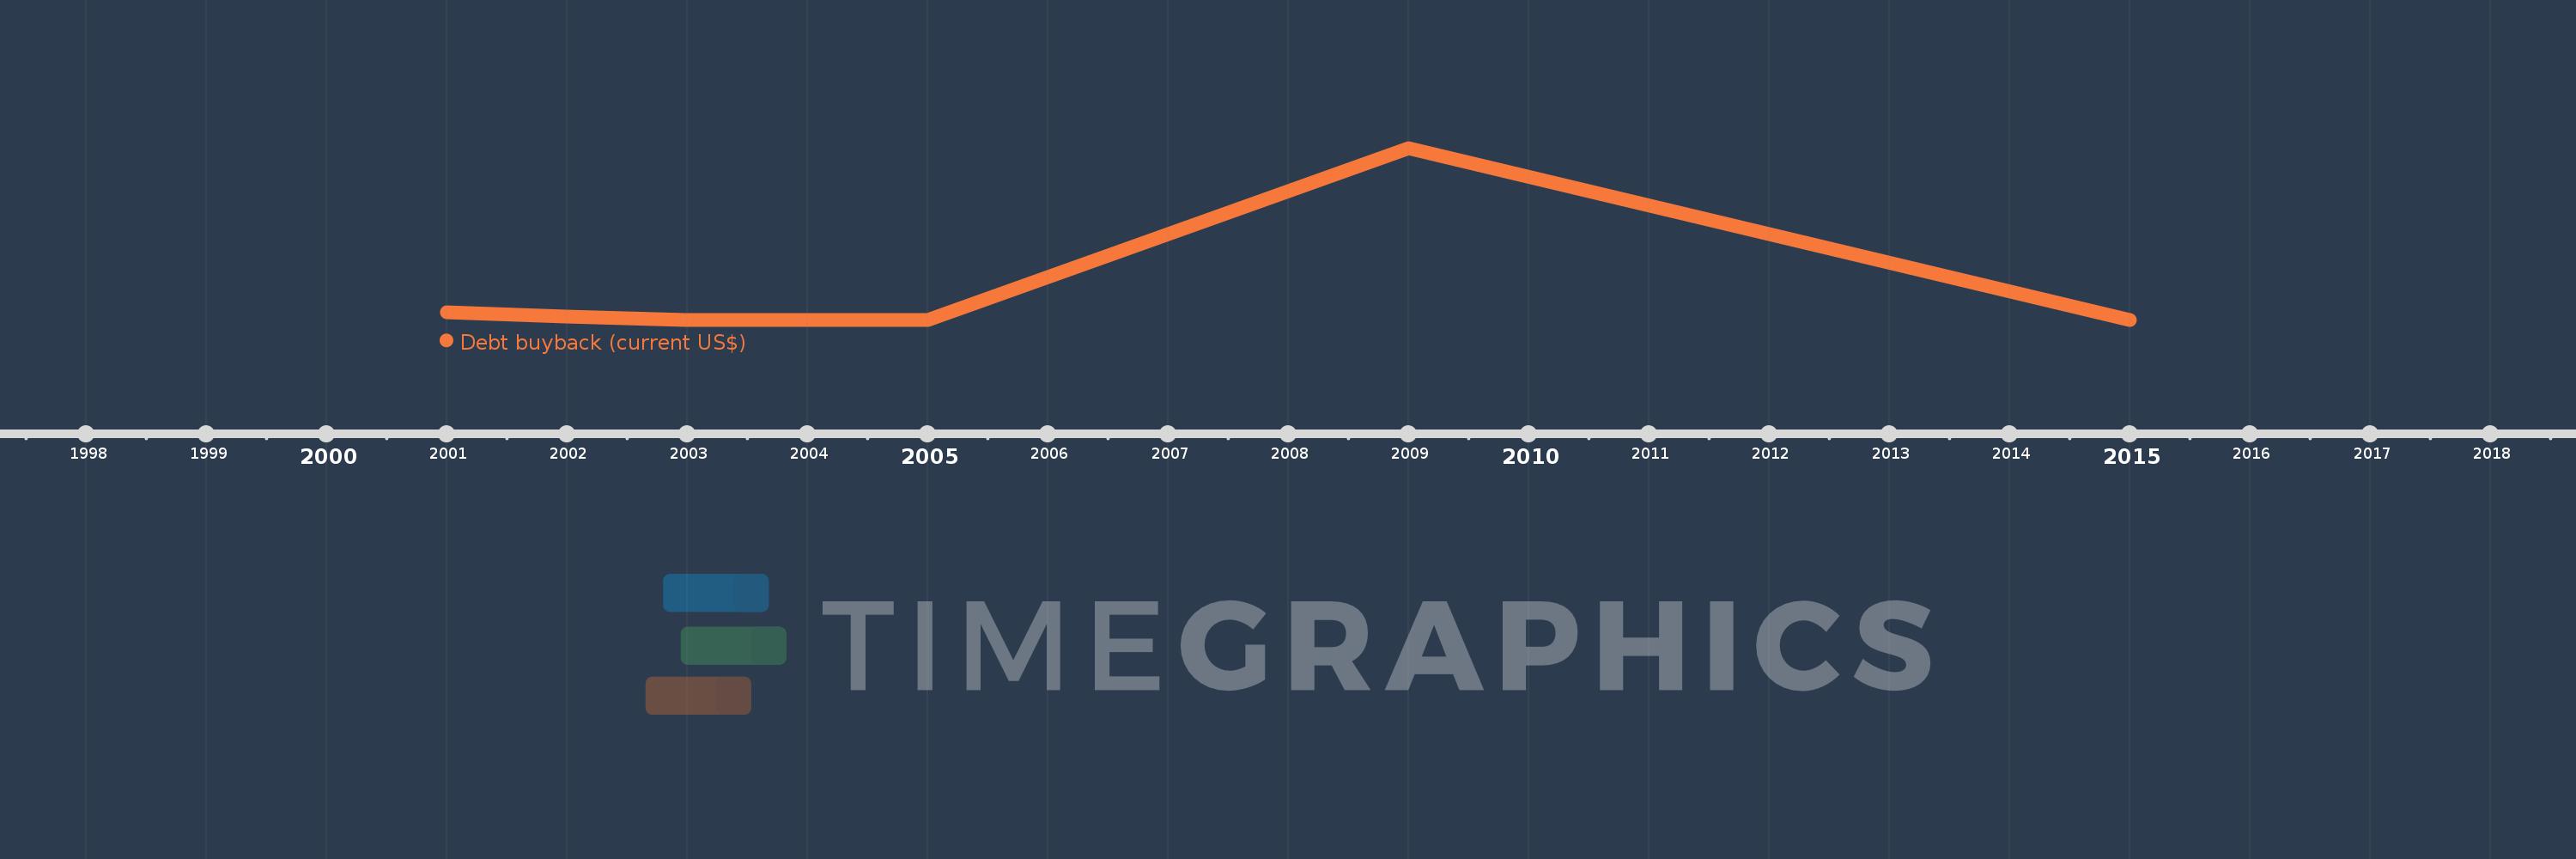
This timeline shows a graph from 2001 to 2015 of Middle East & North Africa (excluding high income). No data until 2000. Number of actual observations by date: 7.
Source name:
World Development Indicators
Source organization:
World Bank, International Debt Statistics.
Categories, topics:
External Debt
Last updated:
apr 23, 2017
Indicators value changes by year
Meaning:
308.16 mln
Minimum:
0.0
jan 1, 2003
Maximum:
2.038 bln
jan 1, 2009
At the date of observation
Value
Absolute change
Change from the previous value
jan 1, 2001
84.604 mln
+84.604 mln
0.0%
jan 1, 2002
34.63 mln
-49.974 mln
-59.07%
jan 1, 2003
0.0
-34.63 mln
-100.0%
jan 1, 2004
0.0
0.0
%
jan 1, 2005
0.0
0.0
%
jan 1, 2009
2.038 bln
+2.038 bln
%
jan 1, 2015
0.0
-2.038 bln
-100.0%
Ranking of countries by current statistics by years