Download This statistics in other country:
Timeline:
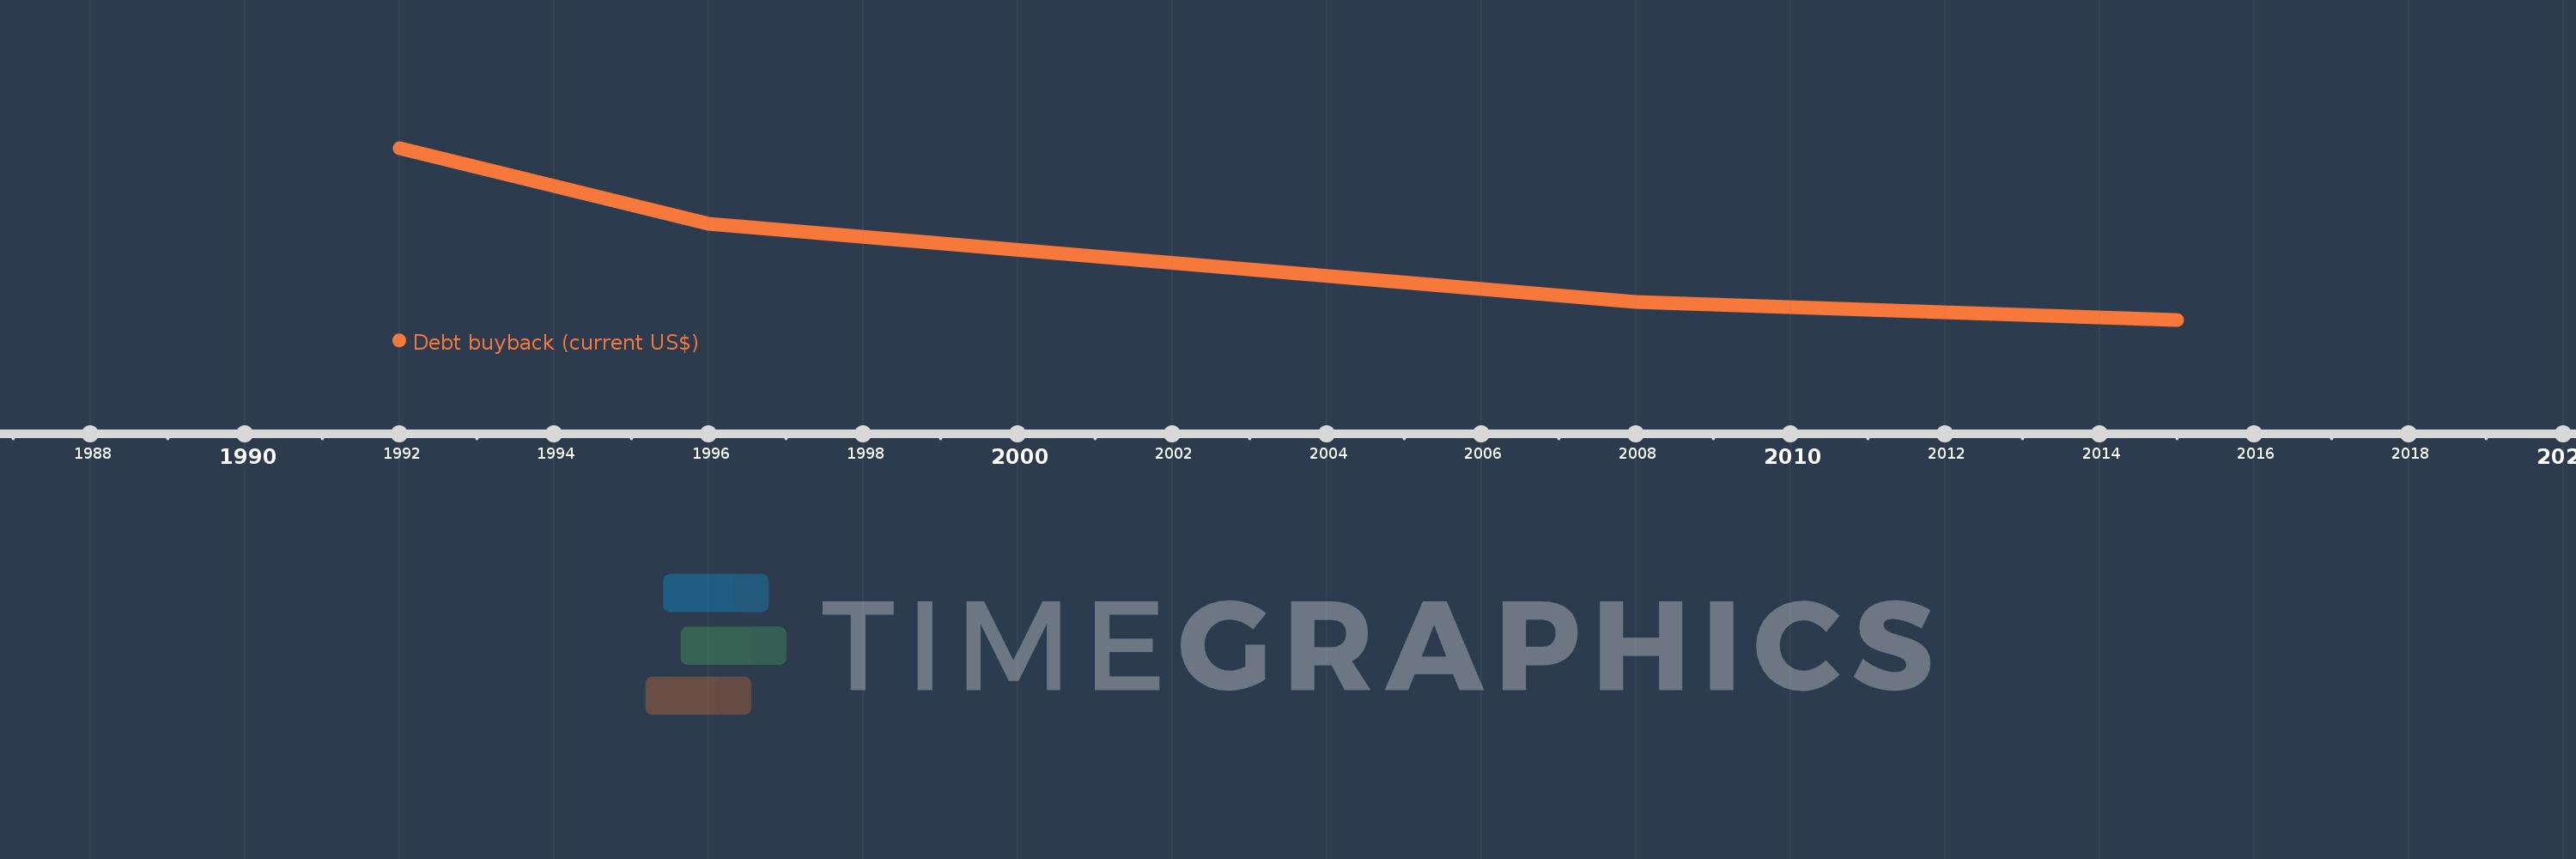
This timeline shows a graph from 1992 to 2015 of Nicaragua. No data until 1991. Number of actual observations by date: 4.
Source name:
World Development Indicators
Source organization:
World Bank, International Debt Statistics.
Categories, topics:
External Debt
Last updated:
apr 23, 2017
Indicators value changes by year
Maximum:
159.261 mln
jan 1, 1992
At the date of observation
Value
Absolute change
Change from the previous value
jan 1, 1992
159.261 mln
+159.261 mln
0.0%
jan 1, 1996
89.082 mln
-70.179 mln
-44.07%
jan 1, 2008
16.537 mln
-72.545 mln
-81.44%
jan 1, 2015
0.0
-16.537 mln
-100.0%
Ranking of countries by current statistics by years