Download This statistics in other country:
Timeline:
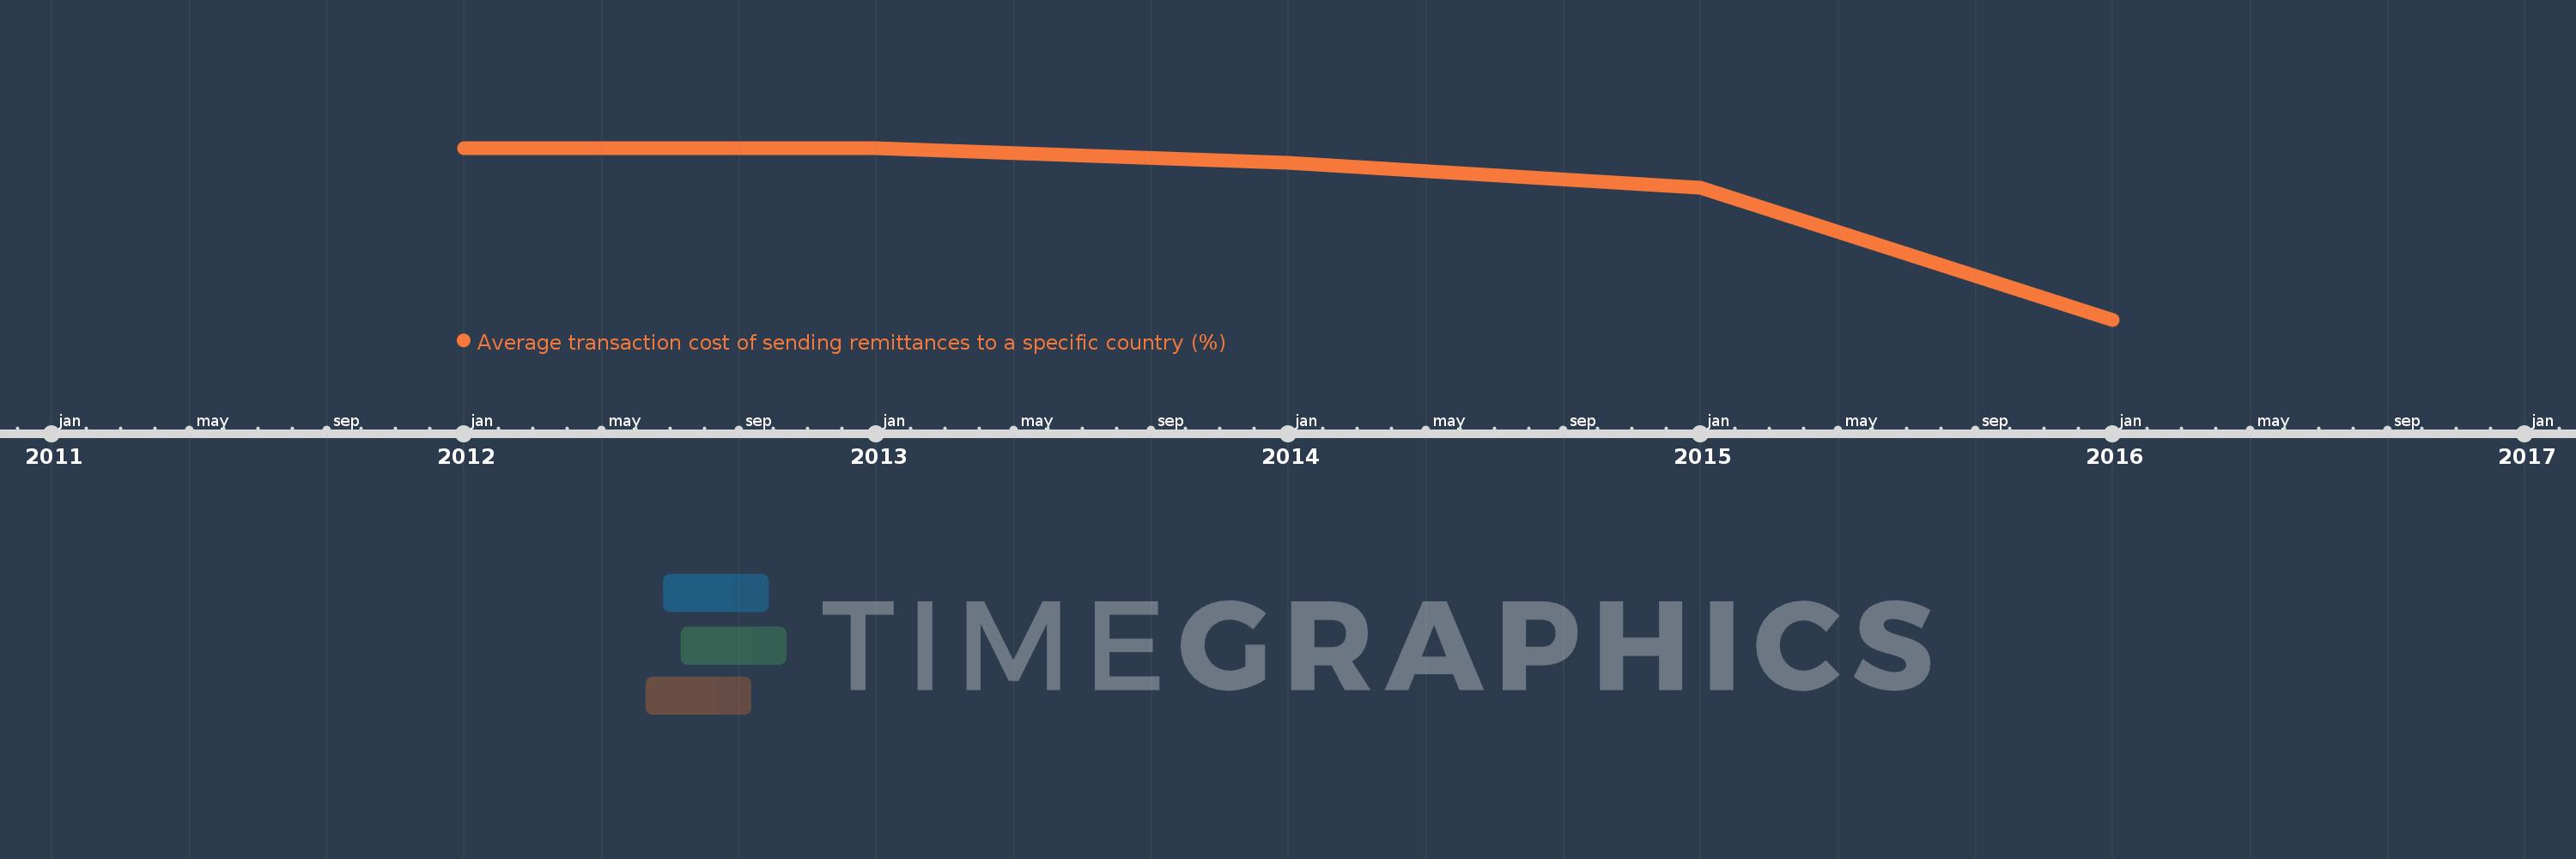
This timeline shows a graph from 2012 to 2016 of Sub-Saharan Africa (excluding high income). No data until 2011. Number of actual observations by date: 5.
Source name:
World Development Indicators
Source organization:
World Bank, Remittance Prices Worldwide, available at http://remittanceprices.worldbank.org
Categories, topics:
Financial Sector
Last updated:
apr 23, 2017
Indicators value changes by year
Minimum:
10.181
jan 1, 2016
Maximum:
12.741
jan 1, 2012
At the date of observation
Value
Absolute change
Change from the previous value
jan 1, 2012
12.741
+12.741
0.0%
jan 1, 2013
12.734
-0.007
-0.06%
jan 1, 2014
12.521
-0.213
-1.67%
jan 1, 2015
12.154
-0.368
-2.94%
jan 1, 2016
10.181
-1.972
-16.23%
Ranking of countries by current statistics by years