Download This statistics in other country:
Timeline:
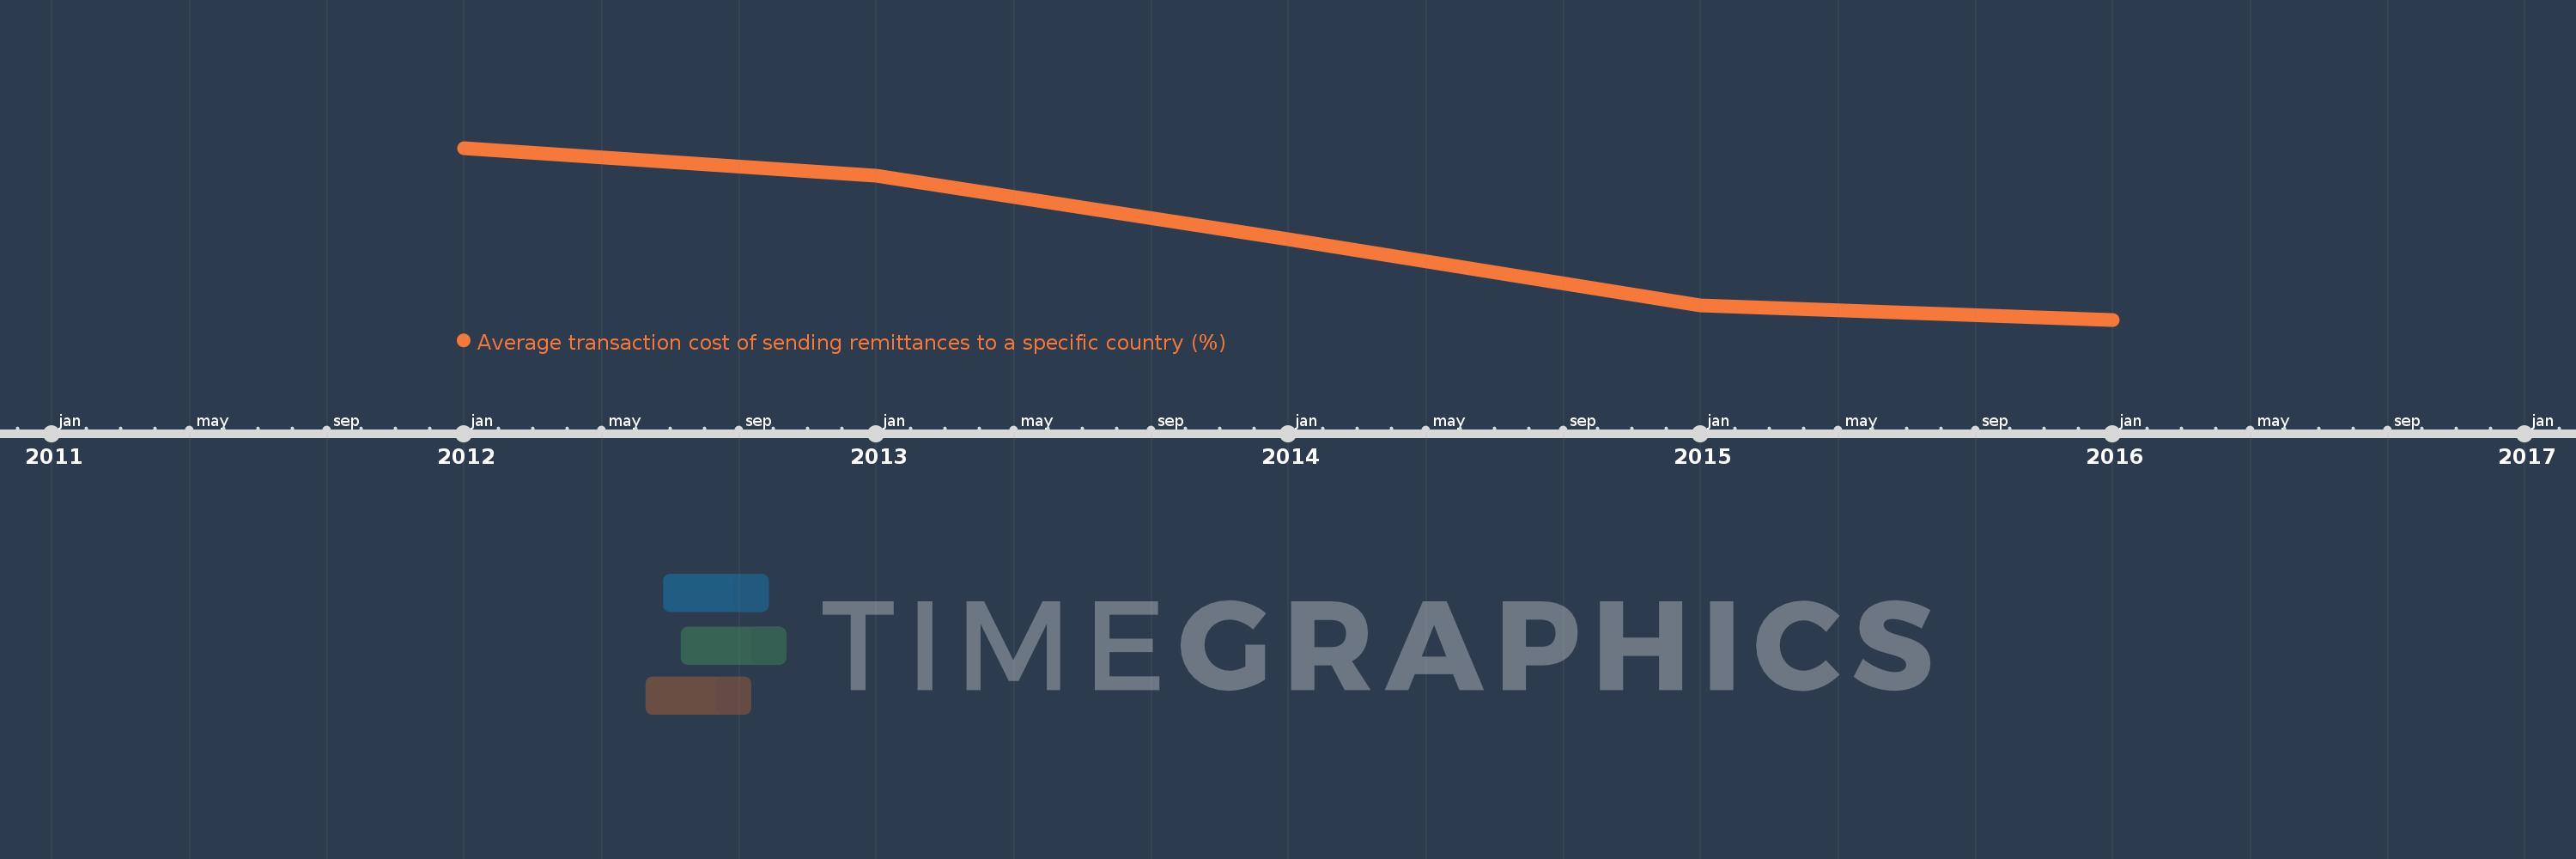
This timeline shows a graph from 2012 to 2016 of Croatia. No data until 2011. Number of actual observations by date: 5.
Source name:
World Development Indicators
Source organization:
World Bank, Remittance Prices Worldwide, available at http://remittanceprices.worldbank.org
Categories, topics:
Financial Sector
Last updated:
apr 23, 2017
Indicators value changes by year
Maximum:
14.459
jan 1, 2012
At the date of observation
Value
Absolute change
Change from the previous value
jan 1, 2012
14.459
+14.459
0.0%
jan 1, 2013
12.884
-1.575
-10.9%
jan 1, 2014
9.302
-3.581
-27.8%
jan 1, 2015
5.617
-3.685
-39.62%
jan 1, 2016
4.786
-0.831
-14.8%
Ranking of countries by current statistics by years